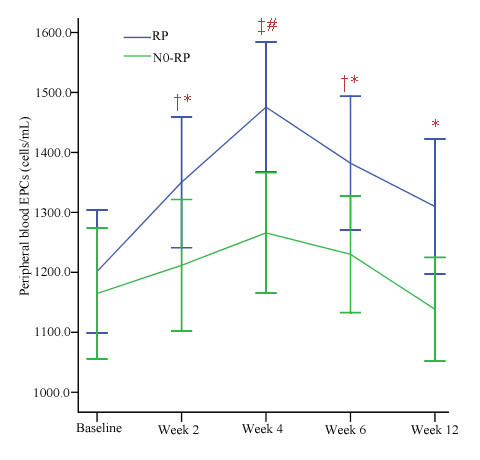
Figure 3.

Change of EPCs during and after the treatment. Variations of endothelial progenitor cells (EPCs) at baseline, during, and after treatment in the RP group and the non-RP group. Values are presented as mean ± S.E. ‡P < 0.01 versus the baseline; †P < 0.05 versus the baseline; #P < 0.01 versus the control group; *P < 0.05 versus the control group.
