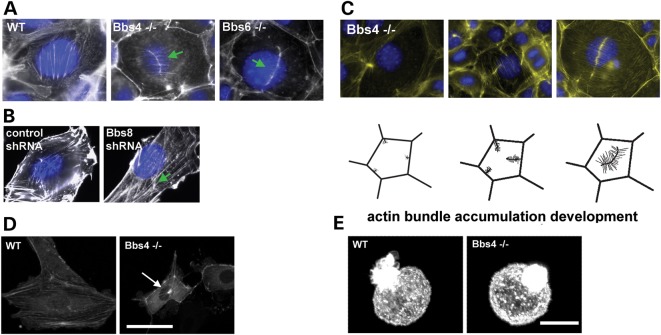
Figure 2.
Bbs depleted cells have a defective actin cytoskeleton. (A and B) Phalloidin (white) and DAPI (blue) staining (A) Bbs4- and Bbs6-deficient primary kidney cells produce actin aggregates in the apical region of the cell, compared with the WT cells. Arrowheads show actin aggregates on the apically in the cell (green arrows). (B) Likewise, NIH3T3 cells depleted for Bbs8 show a similar actin disruption when compared with the non-transfected cells lines. White scale bar 20 μm. Black scale bar 50 μm (green arrow). (C) Phalloidin (green) and DAPI (blue) staining show that aberrant actin filaments originate from the cell membrane. Pictorial representation showing the different degrees of polymerization of newly branched actin filaments ends, and the formation of a hub-like structure at the apex of the cell. Scale bar 20 μm. (D) Snapshots of Actin-GFP transfected WT and Bbs4-deficient cells (see Supplementary Material, movies 3, 4 and 5), showing the aggregation of actin on the apex of Bbs4 null cells. (E) 3D confocal reconstruction images showing the actin organization in WT and Bbs4 null cells in suspension following staining with rhodamine-phalloidin. There were no obvious differences in cortical actin organization between Bbs4−/− and WT cells.

