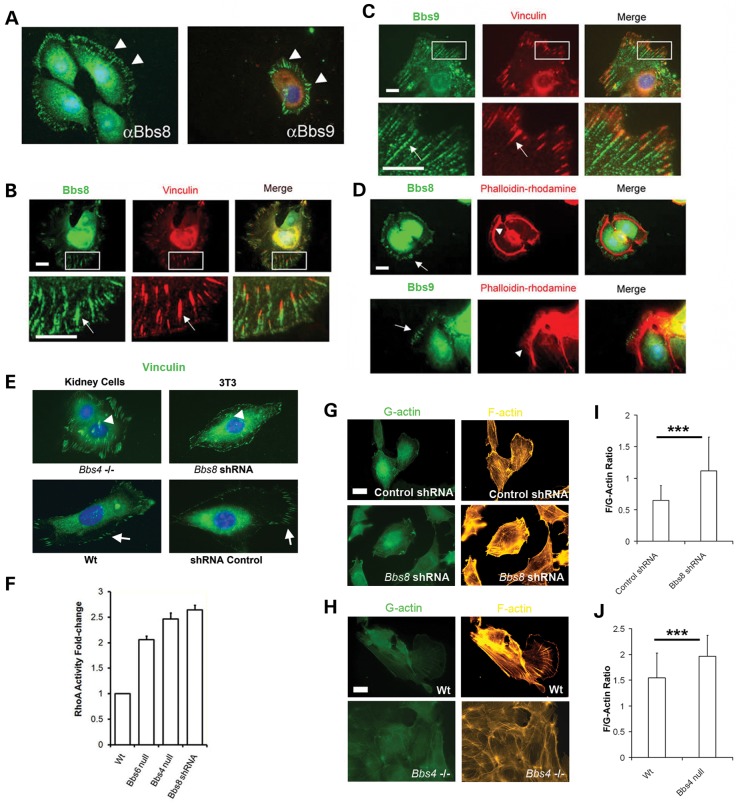
Figure 5.
Bbs8 and Bbs9 are expressed at FAs. (A) Bbs8 and Bbs9 are expressed in the cytoplasm in a radial manner (white arrowheads) in non-confluent migrating mIMCD3 cells. Scale bar 20 μm. (B and C) Both Bbs8 and Bbs9 are coexpressed with vinculin in FAs. Scale bar 20 μm. (D) Bbs8 and Bbs9 localize at the beginning of F-actin filaments (arrowhead). Scale bar 20 μm. (E) Note that the FAs are centralized in Bbs4- and Bbs8-deficient cells (arrowheads) compared with WT cells where FAs are predominating at the cell periphery (arrows). Scale bar 20 μm. Vinculin staining of the FAs. (F) RhoA activity in Bbs-deficient lines. Significantly increased levels of activated RhoA in mutant cells, for example there is a 2-fold increase for Bbs6 null cells (s.e.m ± 0.07); 2.5-fold for Bbs4 null cells (s.e.m ± 0.12) and 2.6-fold for Bbs8-shRNA depleted cells (s.e.m ± 0.09). Data normalized for WT RhoA activity. (G–J) Quantification of the F/G actin ratio in Bbs8-shRNA depleted NIH3T3 cells and Bbs4 primary null kidney cells. Phalloidin-rhodamine and DNAse I-Alexa 488 were used to quantify the emitted fluorescence and calculation of the ratio. The ratio is higher in mutant cell lines (WT 1.54 ± 0.28 versus Bbs4 null 1.96 ± 0.24; P < 0.001. Control shRNA 0.65 ± 0.17 versus Bbs8-shRNA 1.12 ± 0.21; P < 0.001). ***P < 0.001. Scale bar 20 μm.

