
Figure 2.
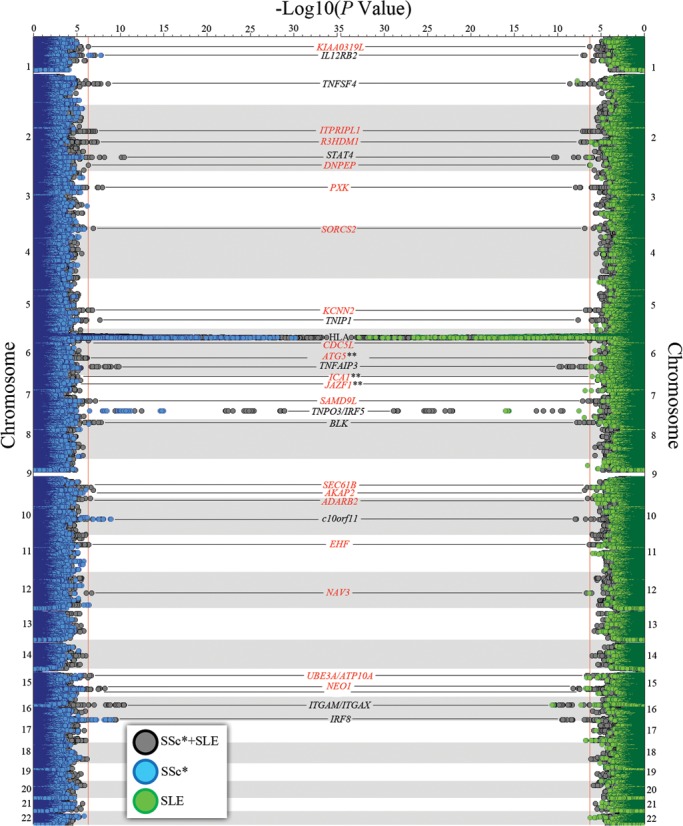
Twin Manhattan plot representing the results of the SSc (left side, blue), SLE (right side, green) and combined GWAS analysis (both sides, grey). Selected loci for replication in independent cohorts are marked in red. *SSc plotting represents either the total disease or any of its considered subphenotypes, i.e. ACA positive, ATA positive, lcSSc and dcSSc. **ICA1 and JAZF1 SNPs were selected according to selection criteria three (see Materials and methods), and not because of reaching the significance threshold in the GWAS stage.