
Figure 1.
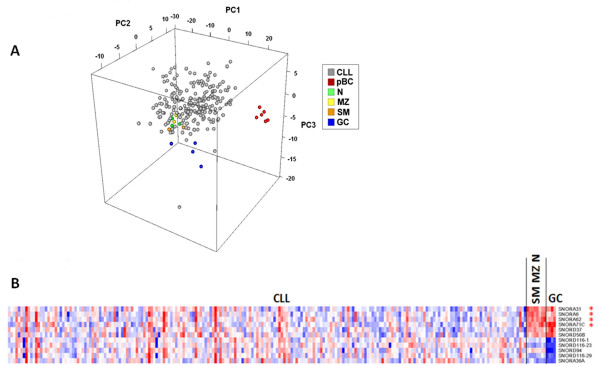
sno/scaRNA expression profile of CLL and normal B-cells. A PCA analysis that includes CLL samples shows that CLLs are closer in a three-dimensional space of similarity to SM, N and MZ tonsillar B-lymphocytes than to other B-cell types, based on the expression of 215 snoRNA and 17 scaRNA genes (A). Heatmap of the differentially expressed sno/scaRNAs in CLL patients, N-SM-MZ B-cells, and GC B-cells. snoRNAs also resulting from two-class supervised analysis comparing CLL and N-SM-MZ B-cells group, are marked with an asterisk (B).