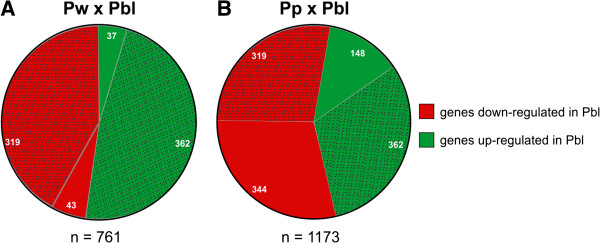
Figure 2.

Number of DEGs in the microarray analysis. (A) Comparison between newly-ecdysed-pupae (Pw phase) and pharate-adults (Pbl phase). (B) Comparison between pupae-in-apolysis (Pp phase) and pharate-adults (Pbl). The dotted areas in the graphs represent the number of DEGs that are common to both comparisons.
