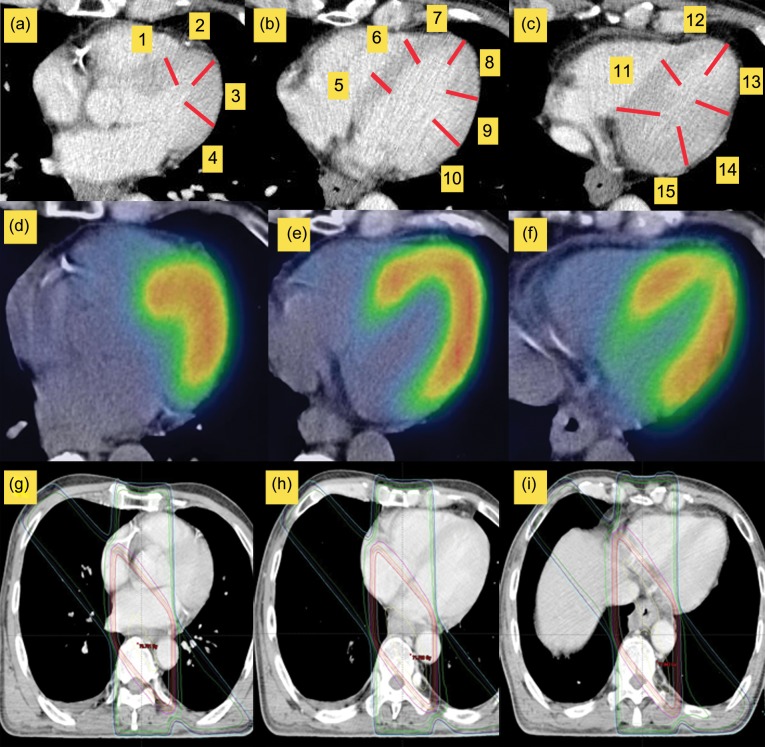
Fig. 2.
15-segment model in a computed tomography (CT) axial image. (a) 4 segments in a CT slice located in the aortic valve. (b) 6 segments in a CT slice in which the left ventricle space was the largest. (c) 5 segments in a CT slice located under the left atrium. Based on this model, we compared single photon emission computed tomography (d–f) with RT fields (g–i).

