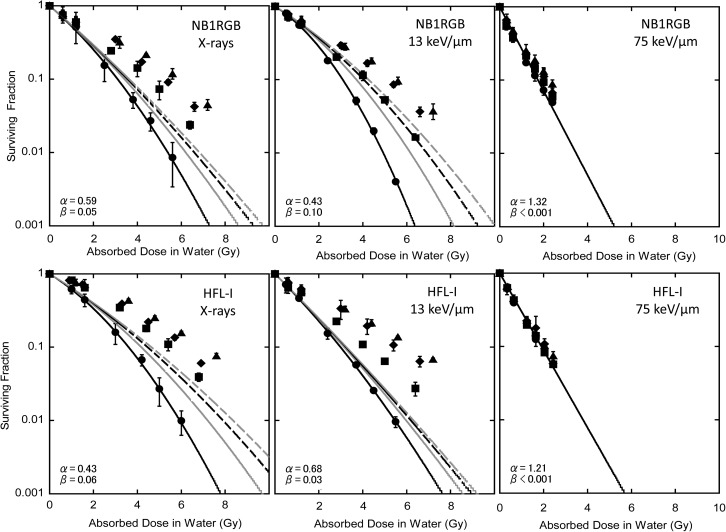
Fig. 2.
Fit to the cell survival data by eq. (1) with α and β values for single irradiation. Black solid line: single fraction, gray solid line: twice repeated irradiations, black dashed line: three times repeated irradiations, gray dashed line: four times repeated irradiations. Experimental data: closed circles for single fraction, closed squares for twice repeated irradiations, closed diamonds for three times repeated irradiations, and closed triangles for four times repeated irradiation.

