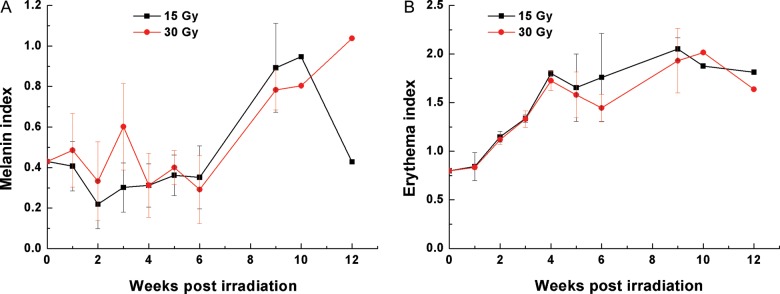
Fig. 4.

Spectrophotometry data. (A) The mean value of melanin indices is plotted against time post-irradiation. Melanin indices began rising 6 weeks after irradiation. (B) The mean value of erythema indices is plotted against time post-irradiation. Erythema indices began rising soon after irradiation and continued to increase.
