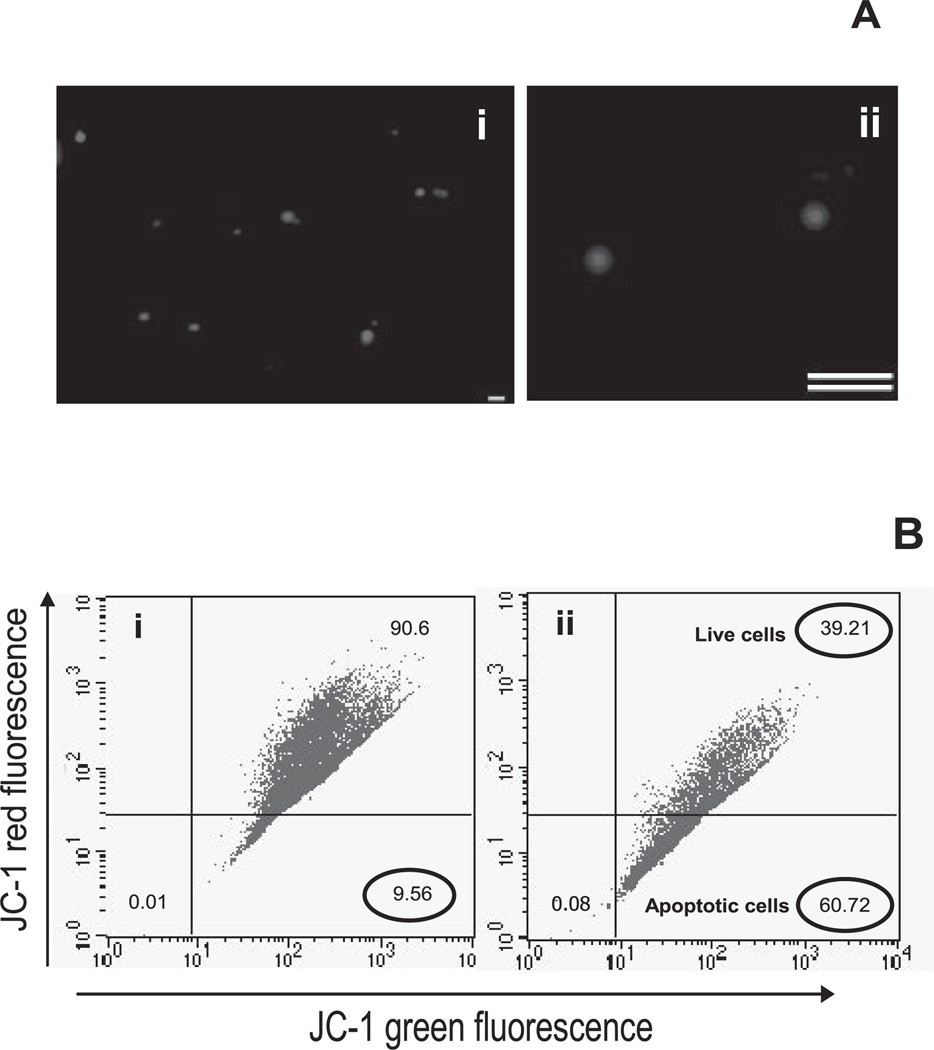
Figure 3.
Quantification of apoptotic bodies. (A) PI-stained apoptotic bodies were observed to be present in the range of 1 to 5 µm. (B) Apoptosis was confirmed by using JC-1 flow cytometry. The initial gate (bottom left) was selected by excluding debris and using healthy endothelial cells. Verteporfin induced robust apoptosis and thus a marked decrease in the red to green fluorescence, with 60% apoptotic cells, whereas untreated healthy counterparts showed the presence of 9% apoptotic cells. Flow cytometry dot plots are representative of three independent experiments. Scale bar, 10 µm.

