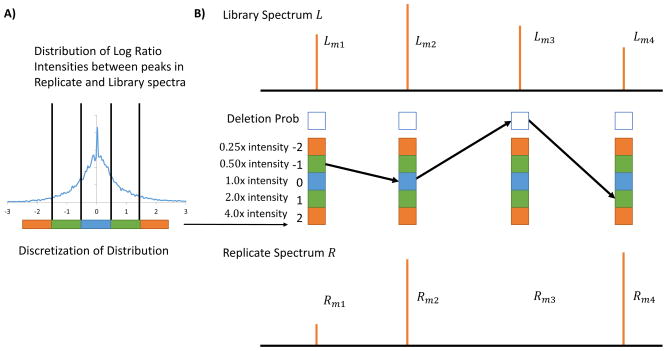
Figure 1.
Spectral Library Generating Function (SLGF) calculation of Spectrum-Spectrum Match (SSM) significance by modeling instrument variation in peak intensity measurements in replicate spectra of the same compound. In (A) the empirical distribution of variations in intensity measurements is assessed and discretized. (B) Every possible replicate spectrum R is represented by a path through each library peak’s possible intensity variations, thus representing every possible combination of variations of peaks in library spectrum L. Note that some replicate spectra (paths) are invalid, i.e. replicate spectra that do not have Euclidean norm 1; intermediate paths with norm < 1.0 are allowed during the calculation but paths resulting in euclidean norm ≠ 1.0 must be discarded when calculating the distribution of cosine scores.

