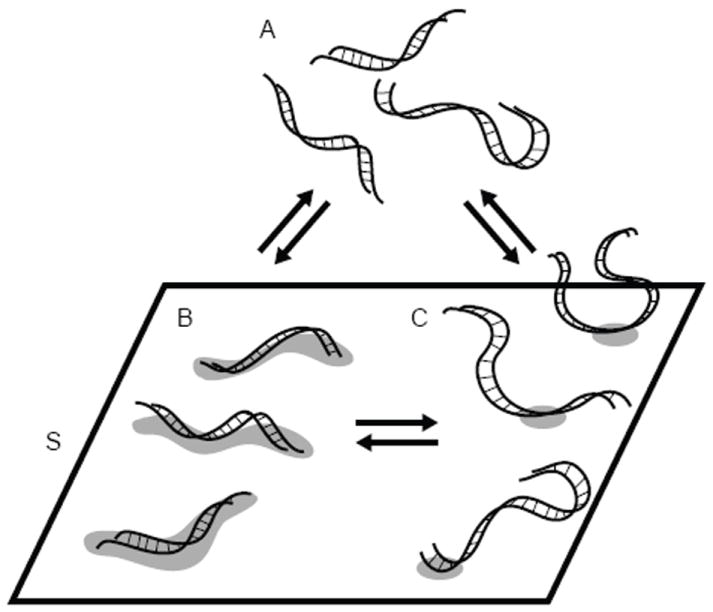
Figure 6.

Model for DNA adsorption to silica. A represents bulk DNA in solution, S denotes the available surface binding sites. B and C represent DNA tightly and loosely bound to the surface through multiple binding sites or a singe binding site, respectively.
