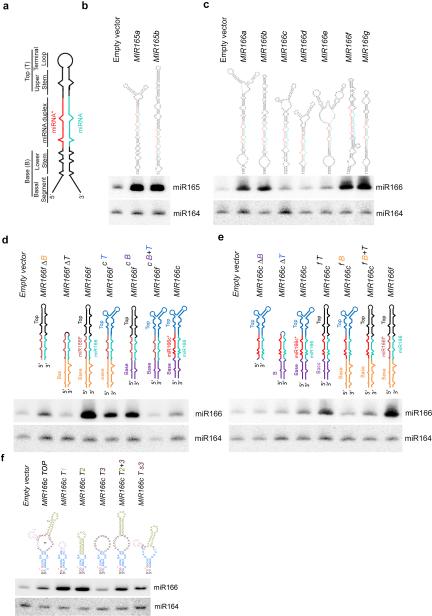
Figure 1.
Secondary structures of pri-miRNAs affect miRNA abundance in vivo. (a) Schematic structure of a representative pri-miRNA. (b and c) sRNA blot analysis of miR165 and miR166 in T1 transgenic plants overexpressing nine MIR165 and MIR166 family members. Predicted secondary structures of pri-miR165/166s are shown on the top. miRNA and miRNA* are marked as turquoise and red, respectively. Total RNA was prepared from a pool of T1 transformants (n>200 for each construct). sRNA blots were probed using 5′ end 32P-labelled oligo probes complementary to the indicated miRNAs. miR164 serves as a loading control. (d and e) sRNA blot analysis of miR166 in the T1 stable transformants overexpressing deletion (Δ) or element-swapped mutants of pri-miR166f (d) and pri-miR166c (e). Bases (B), miRNA/*s, and Tops (T) of pri-miR166c and pri-miR166f are shown in different colors in the schematic structures. sRNA blot assays were performed as in Panels (b and c). (f) sRNA blot analysis of miR166 in the T1 stable transformants overexpressing MIR166c with various deletions in the terminal loop. Schematic structures of terminal regions of pri-miR166c deletion mutants are shown on the top. Loops # 1, 2, and 3 are shown in pink, greenish yellow and maroon, respectively. sRNA blot assays were done as in Panels (b and c). Related uncropped images can be found Supplementary 9.

