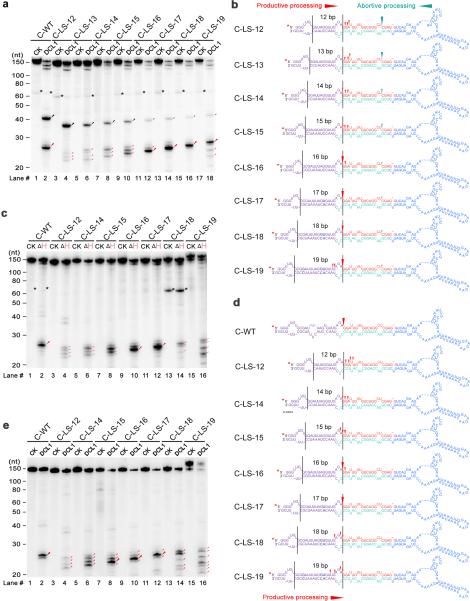
Figure 5.
DCL1 complexes adjust cleavage sites toward the edge of internal loops through the helicase domain. (a) In vitro DCL1 reconstitution assays with ATP. (b) Schematic illustration of the cleavage products from the panel (a). (c) In vitro DCL1 reconstitution assays with DCL1 (ΔH) and ATP. (d) Schematic illustration of the cleavage products from the panel (c). (e) In vitro DCL1 reconstitution assays without ATP. Schematic illustration of the cleavage products from the panel (e) was similar to (d) and thus omitted here. In panels (a-e), the substrates were the 5′ end labeled transcripts of pri-miR166c mutants with varying distances between internal loops and the reference sites. Immunoprecipitation, cleavage assays and RNA processing were performed as described in Figure 2b. The positions of intact substrates, cleavage products, and RNA markers are shown. Black asterisks show non-specific cleavage products frequently present in the assay system. Large and small red arrows show the predominant and minor cleavage sites while turquoise arrows indicate abortive processing sites. Black lines mark the locations of reference sites and internal loops. Red asterisks on the transcripts indicate 32P-labelling positions. Note: predominant cleavages at the edges of internal loops in C-LS-18 and C-LS-19 disappeared in (c) and (e) compared to those in (a).

