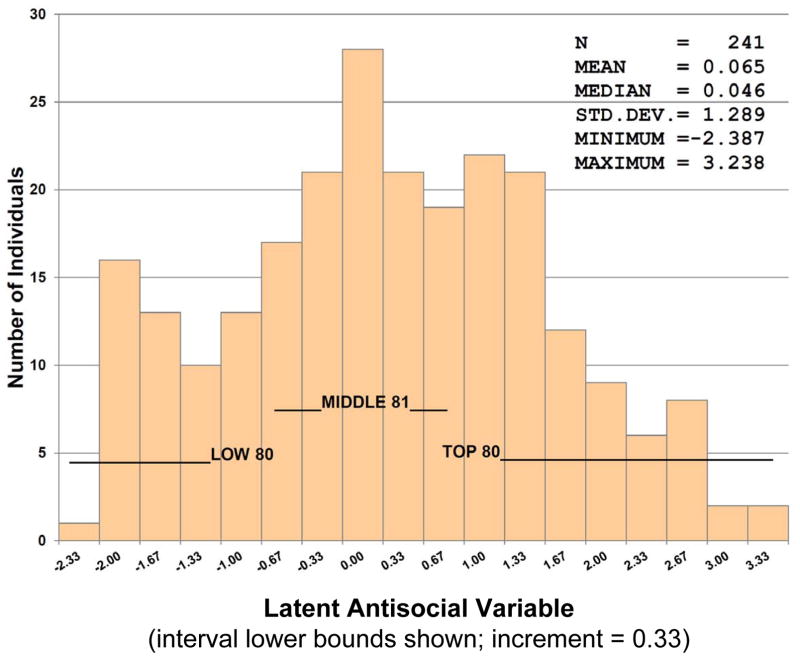
Figure 2. Distribution of the Latent Antisocial Variable Scores.
This figure presents the frequency distribution of latent antisocial variable scores for the 241 individuals who participated in the Nurse Family Partnership randomized clinical trial and provided DNA (see Olds et al., 1998). Low, Middle and Top refer to the three groups (tertiles) based on their latent antisocial variable scores.

