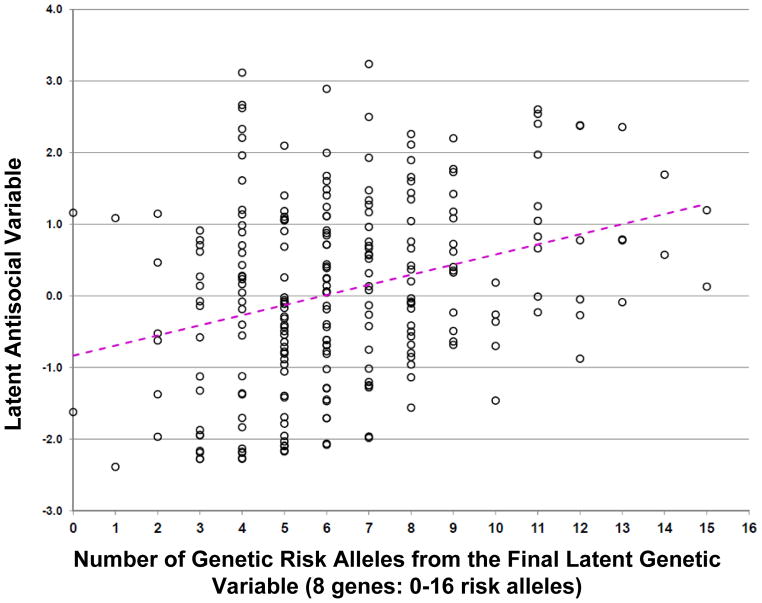
Figure 4. Distribution of the number of risk alleles vs. antisocial latent variable scores in the Final model.
The scatter plot presents the individual data for each of the participants (latent antisocial variable score vs. the total number of the risk alleles (slope y= 0.141 x – 0.836, r2 = 0.091, t = 4.889, d.f. = 239, 2-tailed p= 1.861 × 10⁻⁶).

