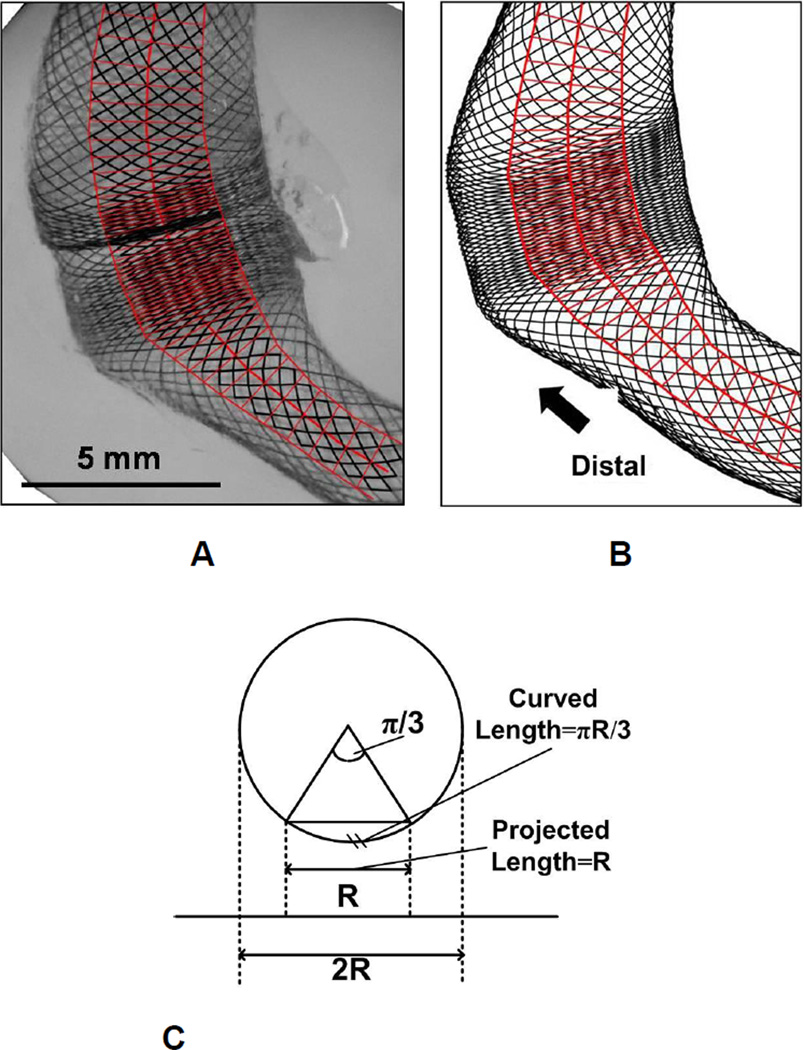
Figure 4.
The sampling boxes (red) laid within central area of the FD mesh for quantification of mesh configuration. (A) Sketch of sampling areas on experimental result (left lateral view of the dense packing scenario). The boxes are drawn along the lumen with width equal to half of the lumen width (to avoid edge effect from 2D image projection) and box heights comparable to the axial diagonal length of a local cell (minimal dividable unit); (B) Sketch of sampling areas on the corresponding numerical result (with the same length scale as A); (C) Schema of the projection of 3D cylindrical surface on 2D image. If the central region with half of the cross section width (diameter) is chosen to represent the curved surface, the relative error in area estimation from 2D projection is (πR/3-R) / (πR/3) = 4.5%.

