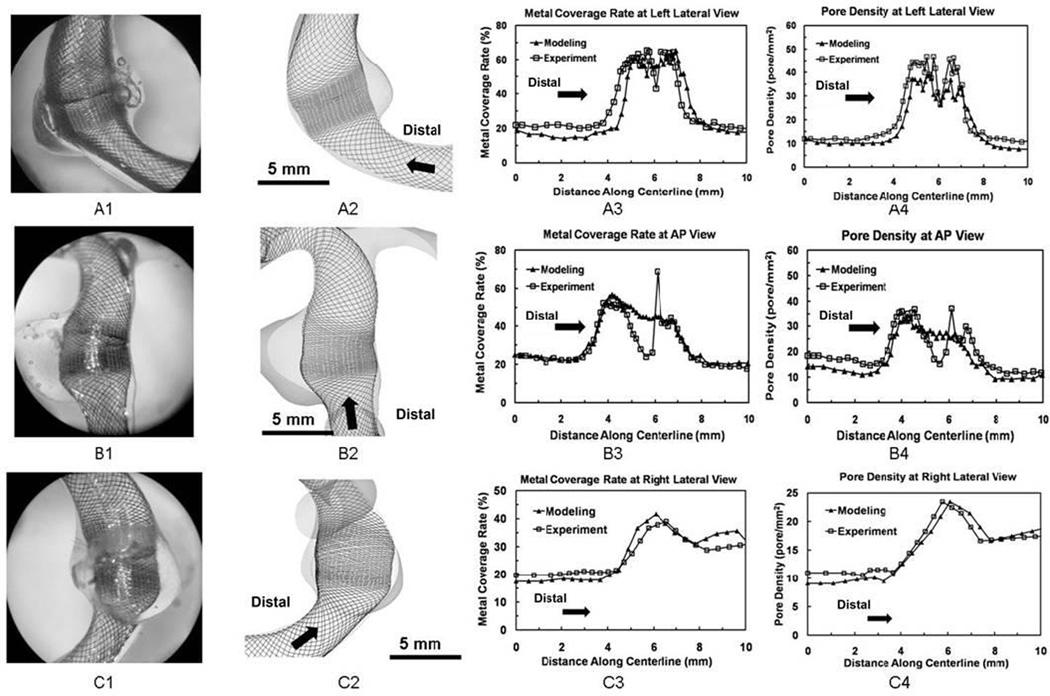
Figure 7.
Completely expanded FDs in experiment and simulation and quantitative comparison of their mesh density distributions for the dense packing scenario. From upper row to bottom row: (A) Left lateral view; (B) AP view; (C) Right lateral view. From left column to right column: 1. experimentally created FD mesh (with the same length scale as column 2); 2. Simulated FD mesh; 3. Plots of metal coverage rate distribution along centerline; 4. Plots of pore density distribution.

