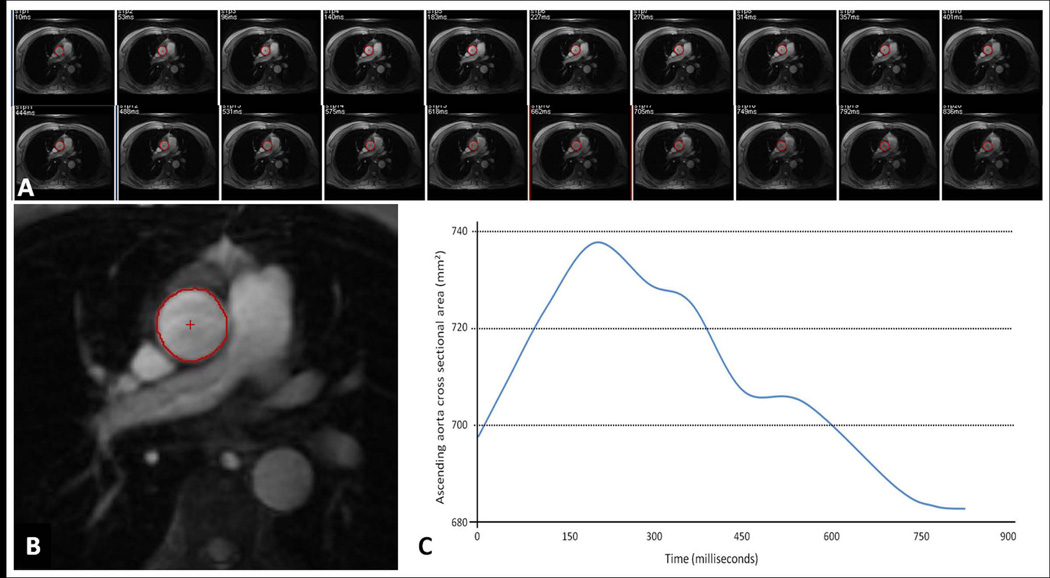
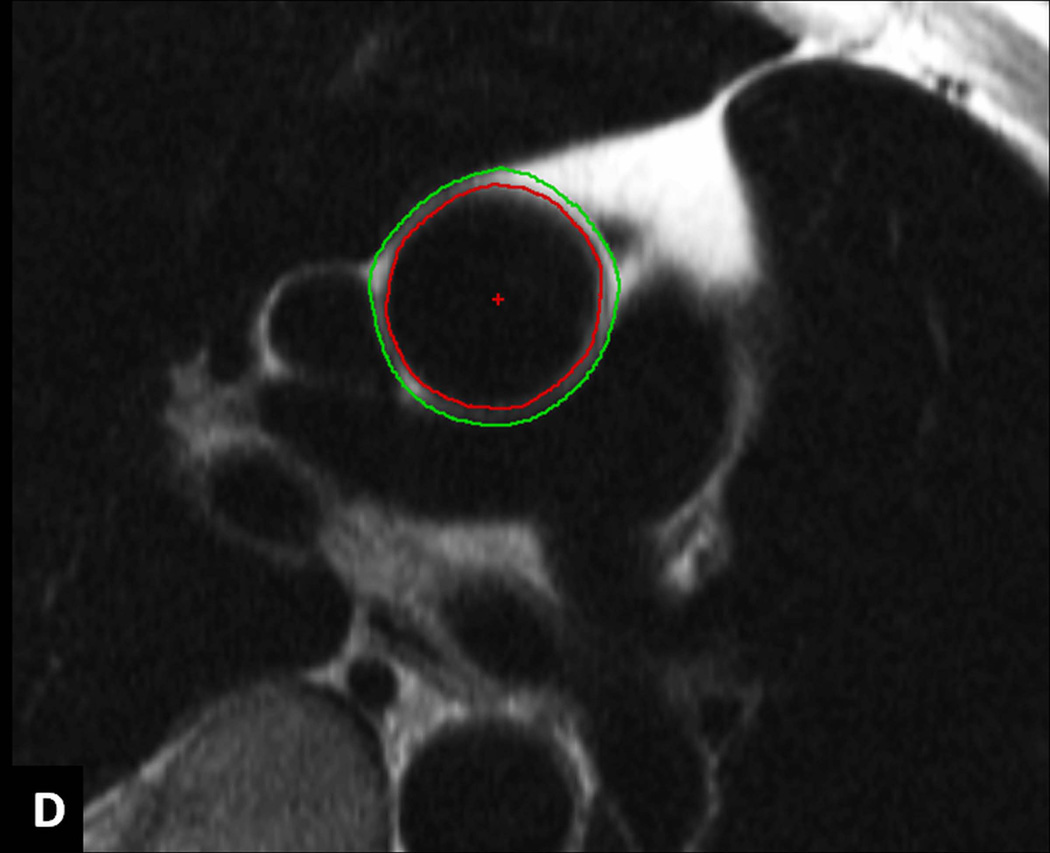
Figure 1.
A–D: Image analysis. Series of modulus images from ECG gated phase contrast aorta MRI at the level of right pulmonary artery (A). A representative image from the series with ascending aorta contour (B). The resulting ascending aorta cross sectional area/ time curve over the cardiac cycle to determine maximum and minimum cross sectional areas (C). ECG gated double inversion recovery black blood fast spin echo image at the same image position during diastole showing the inner and outer contours of ascending aorta to obtain ascending aorta wall thickness (D).


