
FIGURE 3.
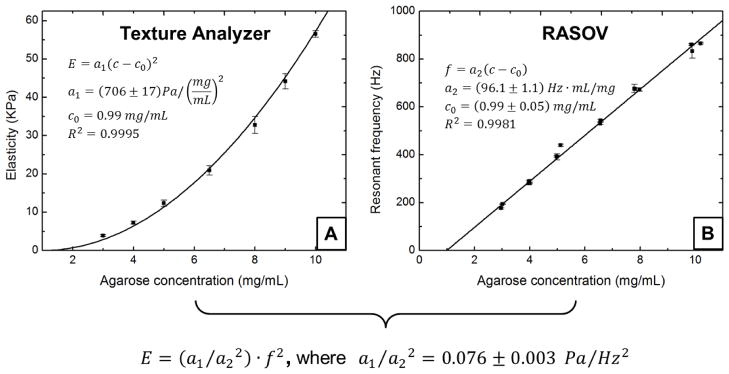
RASOV calibration using agarose gels of varying concentration. (a) Elastic modulus measured using a texture analyzer. (b) Resonant frequency measured using RASOV. Model fitting provides the proportionality constant characteristic of our RASOV system. In this way, a RASOV measurement of f0 provides the CEM of an unknown sample.