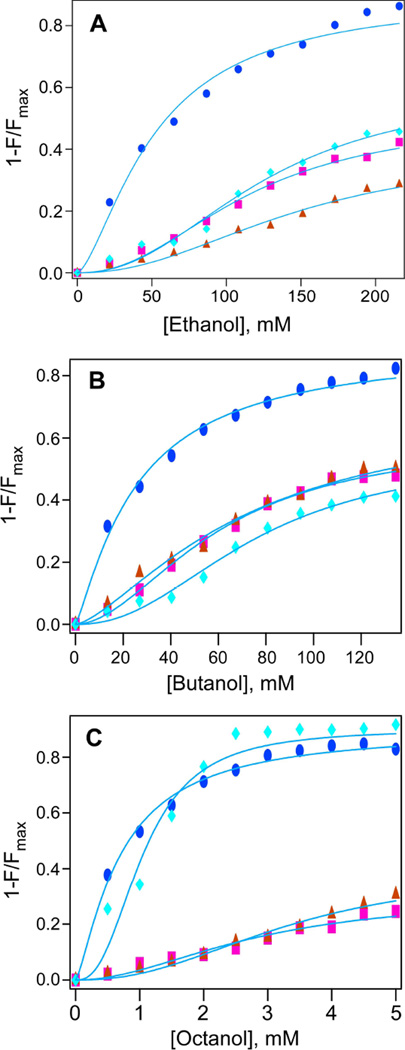
Fig. 2. Effect of alcohol on the intrinsic fluorescence of Munc13-1 C1 (w) and its mutants.
Plot of fluorescence intensity and alcohol concentration for A) ethanol, B) butanol, and C) octanol for the quenching of WT(●), E582A(■), E582L(▲) and E582H(♦) Curved solid lines represent nonlinear least square fits to the logistic equation (see Materials and Methods). F and Fmax are the average fluorescence intensities at 348–350 nm in the presence and absence of alcohol respectively. Protein (1µM) and varying concentration of alcohols were incubated for 15min. Then emission spectra were recorded from 300–500 nm and exciting at 280 nm.

