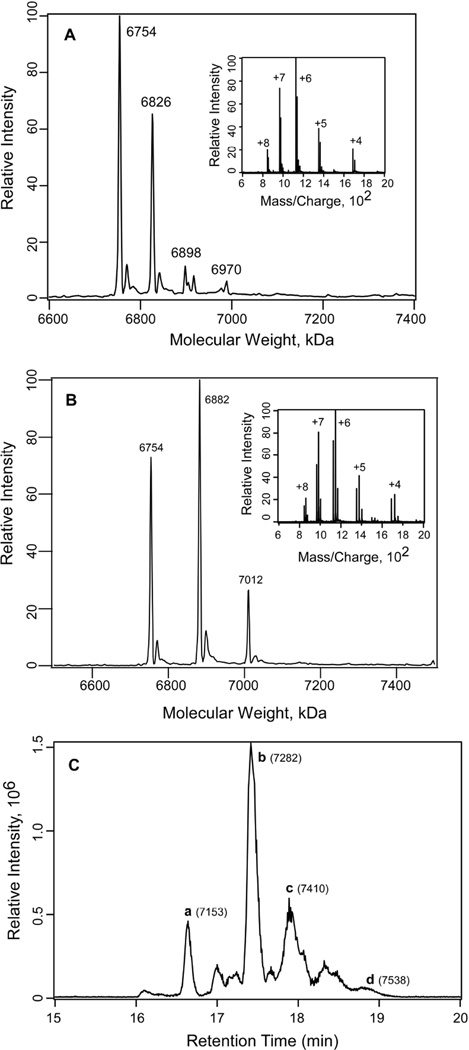
Fig. 3. Photoincorporation of azialcohols into Munc13-1 C1.
A) Deconvoluted mass spectrum of the charge envelope of Munc13-1 C1 photolabeled with 1 mM 3-azibutanol. The peaks at 7654 Da, 6826 Da, 6898 Da and 6970 correspond to the photoincorporation of 0, 1, 2 and 3 molecules of azibutanol (addition of 72 Da for each molecule) respectively, to Munc13-1 C1. Inset: the charge envelop of the photolabeled Munc13-1 C1 obtained after the sample was infused into the LTQ linear ion trap mass spectrometer. B) Deconvoluted mass spectrum of the charge envelope of Munc13-1 C1 photolabeled with 1 mM 3-azioctanol. The peaks at 7654 Da, 6882 Da and 7012 Da correspond to the photoincorporation of 0, 1 and 2 molecules of azioctanol (addition of 128 Da for each molecule) respectively to Munc13-1 C1. Inset: the corresponding charge envelop of the photolabeled Munc13-1 C1. C) LC-MS analysis of the 3-azioctanol (5 mM) photolabeled Munc13-1 C1 sample after reduction with DTT and alkylation by iodoacetamide. Total ion chromatogram for the 3-azioctanol labeled Munc13-1 C1. The peaks a, b, c and d and the corresponding masses in the bracket represent the photoincorporation of 0, 1, 2 and 3 molecules 3-azioctanol respectively to Munc13-1 C1.

