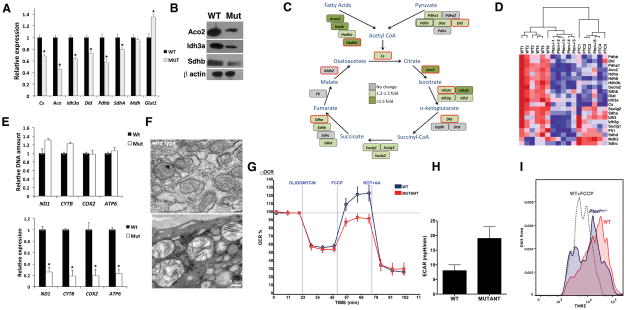
Figure 1. Metabolic reprogramming in Ptenthyr−/− mice.
(A) Relative expression of the indicated genes in wild type and mutant thyroids. Bars represent mean ± SD of triplicate measurements. Asterisks indicate significant (P<0.05) differences. (B) Western blot showing down-regulation of representative TCA cycle enzymes in mutant glands. (C) TCA cycle diagram showing the genes down-regulated in Ptenthyr−/− thyroids. The color scale reflects changes calculated from the Affymetrix data. Genes circled in red have been validated by qPCR. (D) Heat map showing the repression of TCA cycle genes in Ptenthyr−/− thyroids and in follicular carcinomas (FTC) arising in older mice. (E) DNA content-based assessment of mitochondria number in 3 month-old wild type and mutant mice (top panel). Expression levels of selected mitochondrial genes in the thyroids of wild type and mutant mice (bottom panel). Bars represent mean ± SD of triplicate measurements. Asterisks indicate significant (P<0.05) differences. (F) Mitochondrial damage (swelling, clarification, cristae disruption) in Pten−/− glands detected by transmission electron microscopy. (G) Oxygen consumption rates (OCR) in control and mutant primary thyrocytes cells in response to 1 μg/ml Oligomycin, 1 μM Fluoro-carbonyl cyanide phenylhydrazone (FCCP) or 2 μM Antimycin A + 2 μM Rotenone. (H) Extracellular acidification rate (ECAR) in control and mutant primary thyrocytes cells. P= 0.004). (I) Mitochondrial membrane polarization was measured in primary thyrocytes by flow cytometry using TMRE. FCCP pretreatment of wt cells was used to determine the baseline.

