
Figure 4. AMPK is repressed in Ptenthyr−/− thyroids.
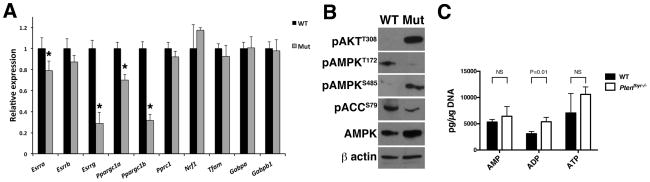
(A) qPCR profiling of metabolic transcriptional regulators in the thyroids of control and mutant mice. Bars represent mean ± SD of triplicate assays. Asterisks indicate significant (P<0.05) differences. (B) Western blotting analysis of AMPK activation in wild type and mutant glands. (C) AMP, ADP, and ATP levels in thyroids from wild type and Ptenthyr−/− mice. Bars represent mean ± SD (n=3 pools of 10 thyroids per genotype).