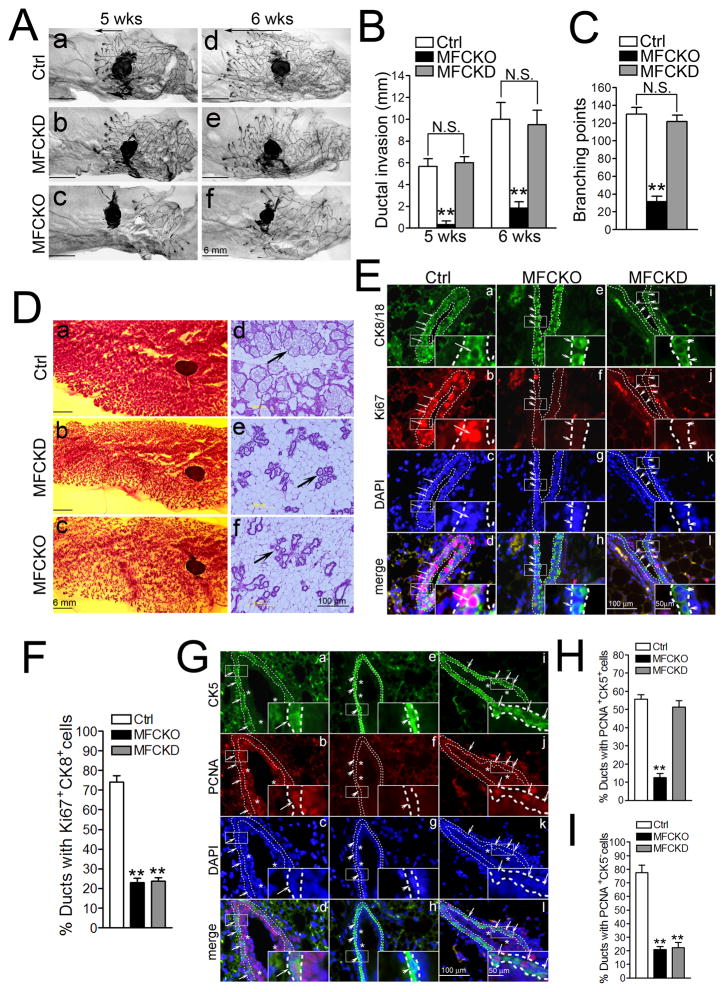
Fig. 3. Analyses of luminal and basal MaECs in MFCKD mice.
(A–C) Whole mount staining of ductal invasion (arrows mark distance between front edge and mammary lymph node) at 5 and 6 weeks. Representative images (A) and Mean±SE of ductal invasion (B) and branch points (C) are shown (n=8 for each). (D) Whole mount or H&E staining of mammary glands at the first day of lactation. (E–I) Mammary glands of virgin mice were analyzed by immunofluorescence using various antibodies, as indicated. Lines outline luminal (E) or basal (G) cells. Long and short arrows mark proliferating and non-proliferating luminal (E) or basal (G) cells, respectively. Asterisks in G mark luminal cells inside the basal/myoepithelial layer. Percentages (Mean±SE) of ducts with Ki67+CK8/18+ luminal cells (F), PCNA+CK5+ basal cells (H) or PCNA+CK5− luminal cells (I) are shown. **P<0.01 NS, not significant.

