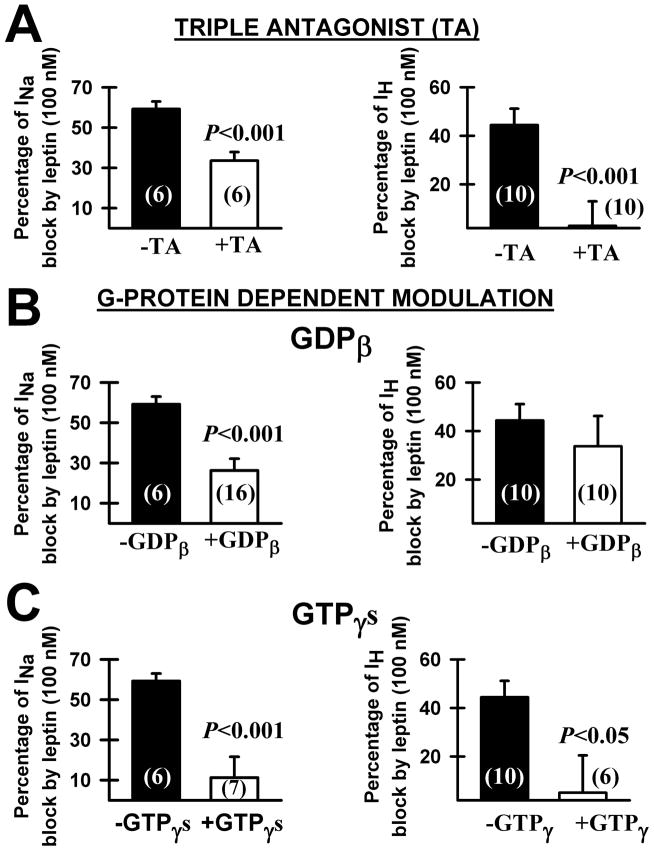
Figure 2. Intracellular mechanisms of leptin action during single-cell recordings of PPN neuron.
A) Percentage of block of whole-cell patch clamp recorded sodium current (INa,left graph) and h-current (IH, right graph) by leptin alone (black columns) compared to leptin + triple antagonist (TA 100 nM, white columns). B) Percentage of sodium current block (left) and h-current block (right) by leptin alone (black columns) compared to leptin + intracellular GDPβ (white columns). C) Percentage of sodium current block (left) and h-current block (right) by leptin alone (black columns) compared to leptin + GTPγS (white columns). Vertical bars represent Mean ± S.E.M. Cell numbers shown in parentheses inside bars. All recordings were performed in the presence of gabazine (10 μM) and strychnine (10 μM).

