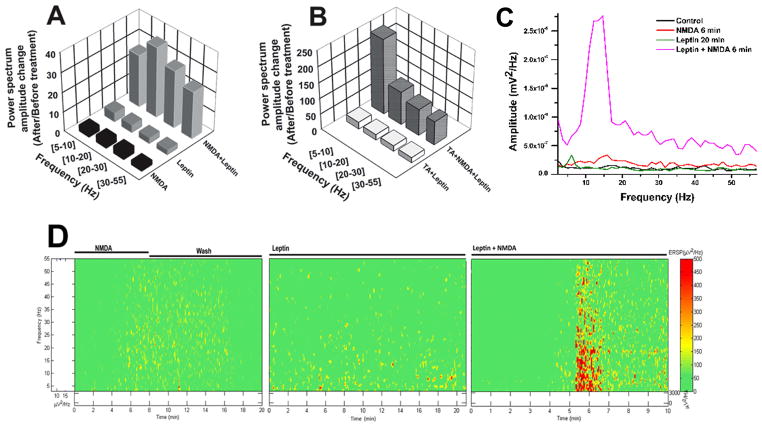
Figure 3. Effects of leptin on PPN population response recordings.
A) Power spectrum amplitude change (after/before treatment ratio) within frequency ranges 5–10 Hz, 10–20 Hz, 20–30 Hz, and 30–55 Hz compared to baseline population activity after NMDA (10 μM, black bars), after leptin (100 nM, solid gray bars), and after NMDA+leptin (gridded gray bars). B) Power spectrum amplitude change within frequency ranges 5–10 Hz, 10–20 Hz, 20–30 Hz, and 30–55 Hz compared to baseline population activity after triple antagonist (50 nM) + leptin (white bars), and triple antagonist + leptin + NMDA (plaid gray bars). C) Power spectrum of PPN activity from a representative slice at control (black), NMDA alone (6 min, red), leptin alone (20 min, olive), and leptin+NMDA (6 min, pink). D) ERSP (see methods) generated from the power spectrum data from slice in “C” showing how leptin+NMDA increased activity at all frequencies from 5–55 Hz, while the largest potentiation by leptin was in lower frequency ranges (<20 Hz). See Table 1 for statistical comparisons across groups.

