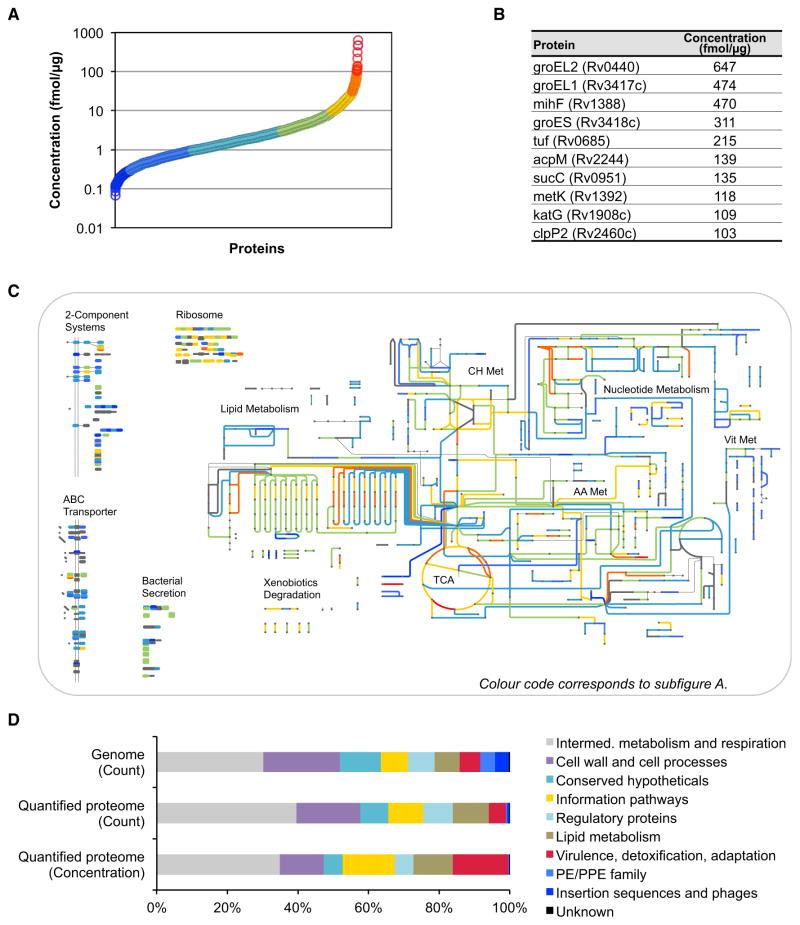
Figure 4. Proteome-wide Absolute Abundance Estimates for Mtb.
SRM-based absolute label-free abundance estimates for every protein identified by SRM with two or more peptides (2,195 proteins). The abundance estimate has a mean fold error of 2.1 ± 0.6.
(A) Abundance distribution of all quantified proteins.
(B) Absolute concentrations of the ten most abundant proteins in Mtb.
(C) Absolute concentrations mapped on selected protein classes and the metabolic network of Mtb (http://pathways.embl.de/iTuby). Colors correspond to the ones in (A).
(D) Abundance distribution among the functional classes of Mtb as defined in TubercuList. The first and second rows show the distribution of genes in the genome and of the quantifiable proteins, respectively. The third row shows the relative protein concentration for each functional class.
Abbreviations are as follows: Met, metabolism; TCA, tricarboxylic acid cycle; CH, carbohydrate; AA, amino acid; and Vit, vitamine and cofactor. See also Figure S3 and Table S2.

