Figure 4.

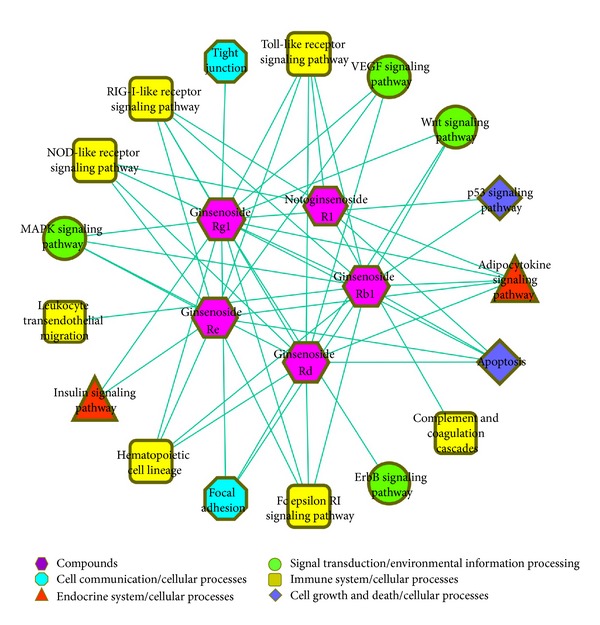
The compound-pathway network of XST. The hexagon nodes represent the compounds. Pathways in different classes were differently colored and shaped. The node size was proportional to the number of interactions between nodes.

The compound-pathway network of XST. The hexagon nodes represent the compounds. Pathways in different classes were differently colored and shaped. The node size was proportional to the number of interactions between nodes.