
Figure 11.
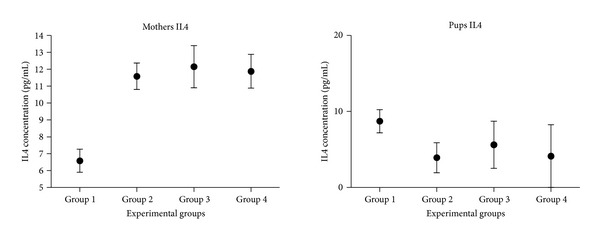
Quantification of interleukin 4 in the serums of mothers and pups. In the x-axis, the different experimental groups are displayed; in the y-axis, the average concentration of IL4 in pg/mL is represented.
Official websites use .gov
A
.gov website belongs to an official
government organization in the United States.
Secure .gov websites use HTTPS
A lock (
) or https:// means you've safely
connected to the .gov website. Share sensitive
information only on official, secure websites.
Quantification of interleukin 4 in the serums of mothers and pups. In the x-axis, the different experimental groups are displayed; in the y-axis, the average concentration of IL4 in pg/mL is represented.