


Figure 8.
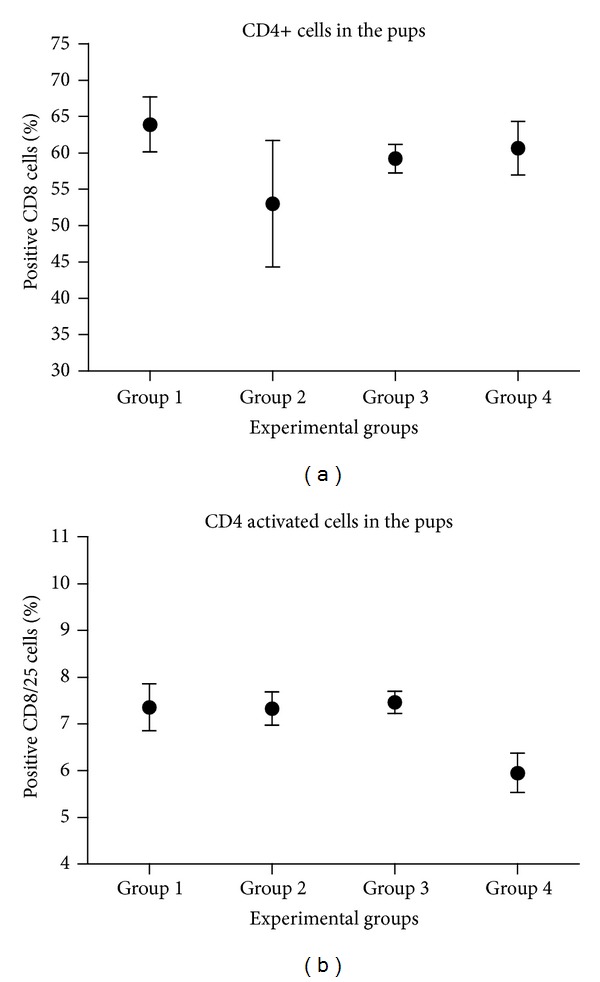
Evaluation of the total CD4 positive lymphocyte population (a) and the activated population (b). In the x-axis, it showed the experimental groups and in the ordinates the average percentage of positive CD4 cells without activating or activated with his bar of error.