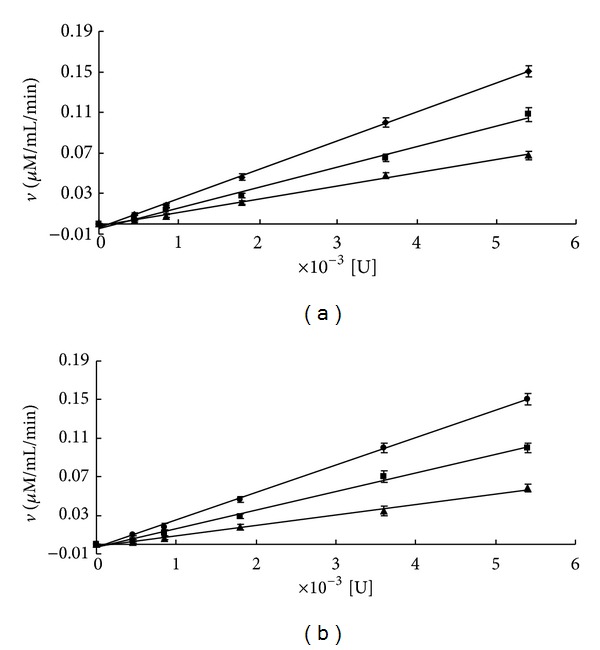
Figure 3.

Kinetics plot of CF and EA to GST. The reaction was carried out at 37°C for 5 min after preincubating GST with CF for 5 min. A plot of ν (μM/mL/min) versus [E] was obtained for GST concentrations from 0.0075 to 0.18 U/mL. Kinetics plots of inhibition to GST at 0%, 20%, and 50% IC for (a) CF (0 μM, 0.25 μM, and 0.5 μM) and (b) EA (0 μM, 2 μM, and 5 μM). Each point shows the mean ± SD of triplicate experiments.
