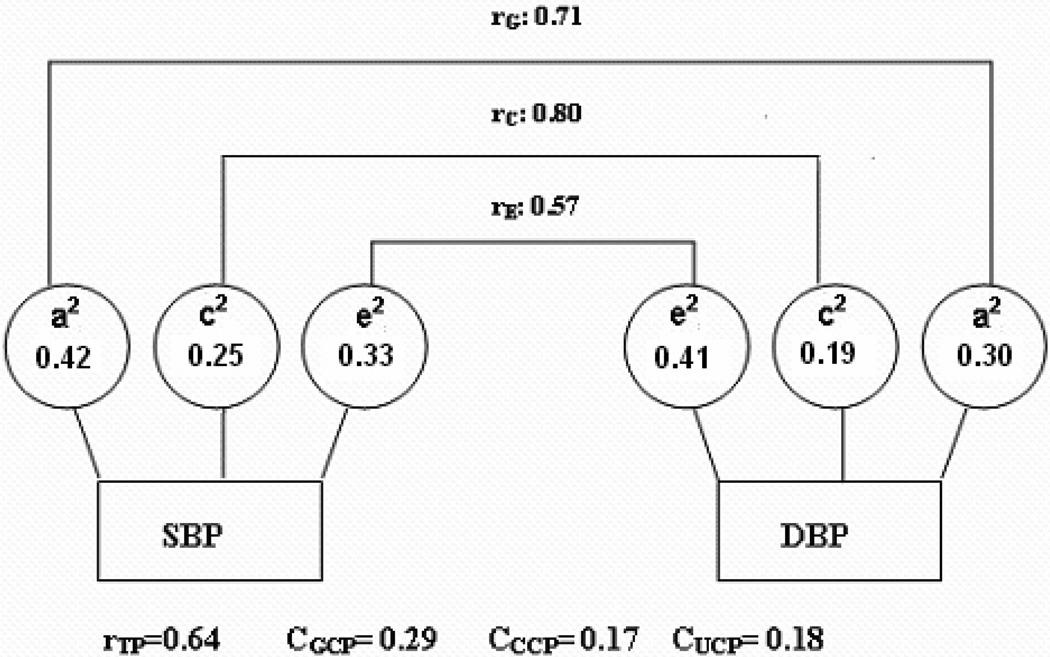
Figure. 1.
Genetic and environmental contributions to the phenotypic correlations of SBP and DBP in 1617 female Chinese twin pairs adjusted with age; rG, rC and rE, genetic, common, and unique environmental correlation; a2, c2, and e2, percentage of total phenotypic variance accounted for by genetic factors, common environmental factors, and unique environmental factors; rTP, total phenotypic correlation; CGCP, Genetic contribution to total phenotypic correlation; CCCP, common environmental contribution to total phenotypic correlation; CUCP, unique environmental contribution to total phenotypic correlation.

