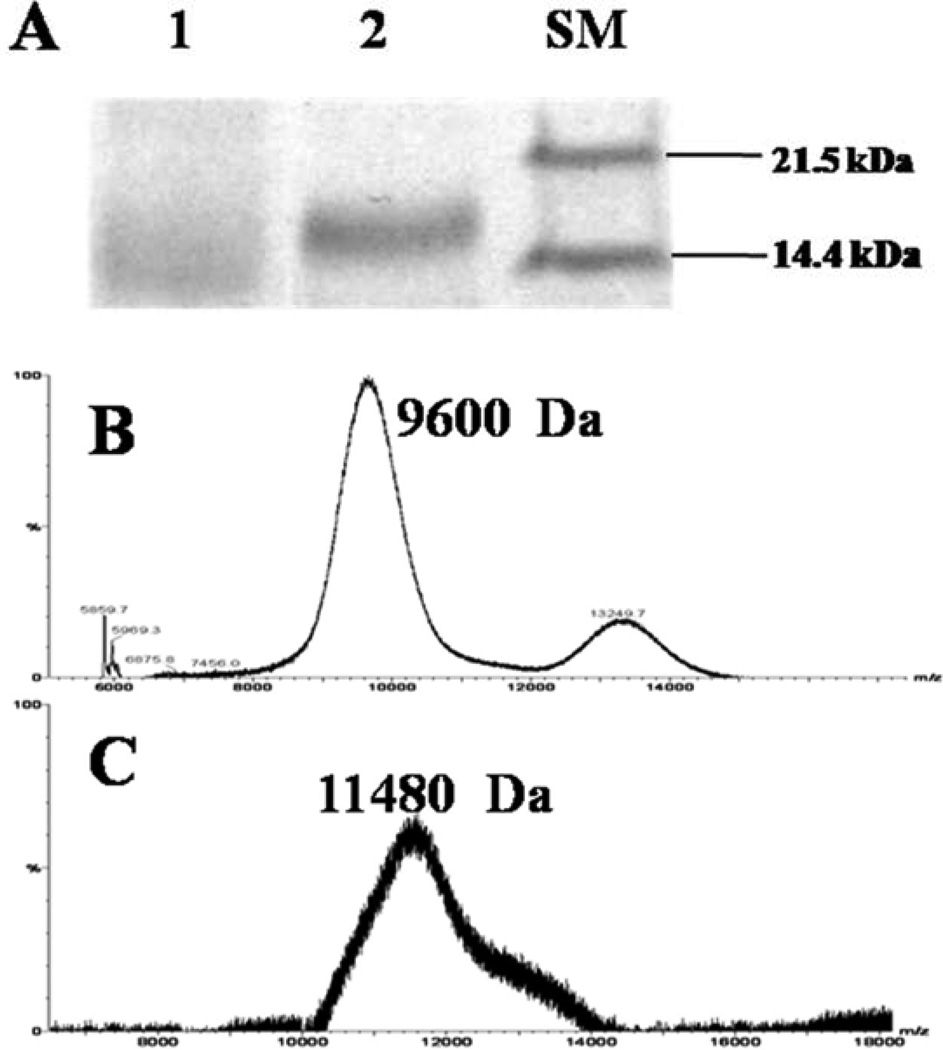
Fig 3.
(A) SDS-PAGE analysis of: Insulin-PEG-MAL (Lane 1), Insulin-PEG-LMWP (Lane 2) and size marker (SM); (B) MALDI-TOF mass spectrum of Insulin-PEG-MAL; (C) MALDI-TOF mass spectrum of Insulin-PEG-LMWP. The peaks around 9,600 Da and 13,249 Da in Fig. 3B were thought to belong to PEGylated Insulin containing one and two PEG chains on each Insulin molecule respectively. The peaks around 11,480 Da in Fig. 3C was thought to belong to Insulin-PEG-LMWP. For experimental details, please refer to the “Materials and Methods” section.

