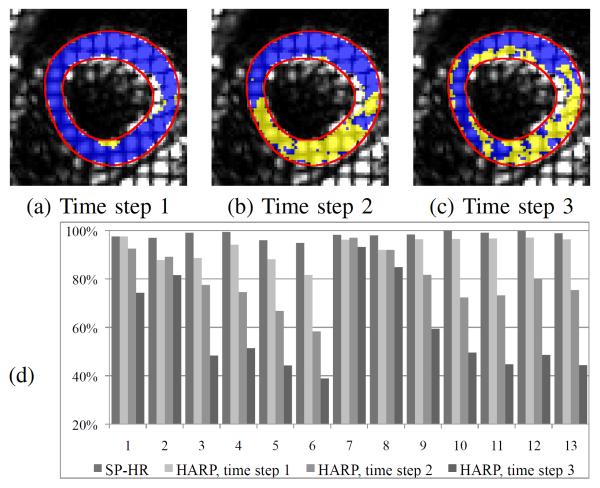
Fig. 10.
Comparison of SP-HR and traditional HARP with different time steps. Correctly tracked regions on one data set using SP-HR and traditional HARP with time steps (a) 1, (b) 2, and (c) 3. Blue: correctly tracked regions using traditional HARP with different time steps; yellow+blue: correctly tracked regions using SP-HR; Red: average LV myocardium boundaries. (d) shows the percentage of correctly tracked points on the 13 test image sequences, which is shown from left to right.

