
Fig. 8.
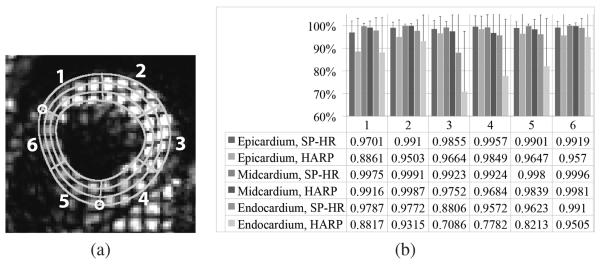
(a) Illustration of the 18 sectors of the LV. The two small circles mark the insertion points between the left and right ventricles. (b) The average ratios of correctly tracked points to total points in all epi-, mid-, and endo-cardial regions over the six sectors, for both SP-HR and traditional HARP tracking. Variances are represented by black lines. The numbers 1–6 represent sector number.