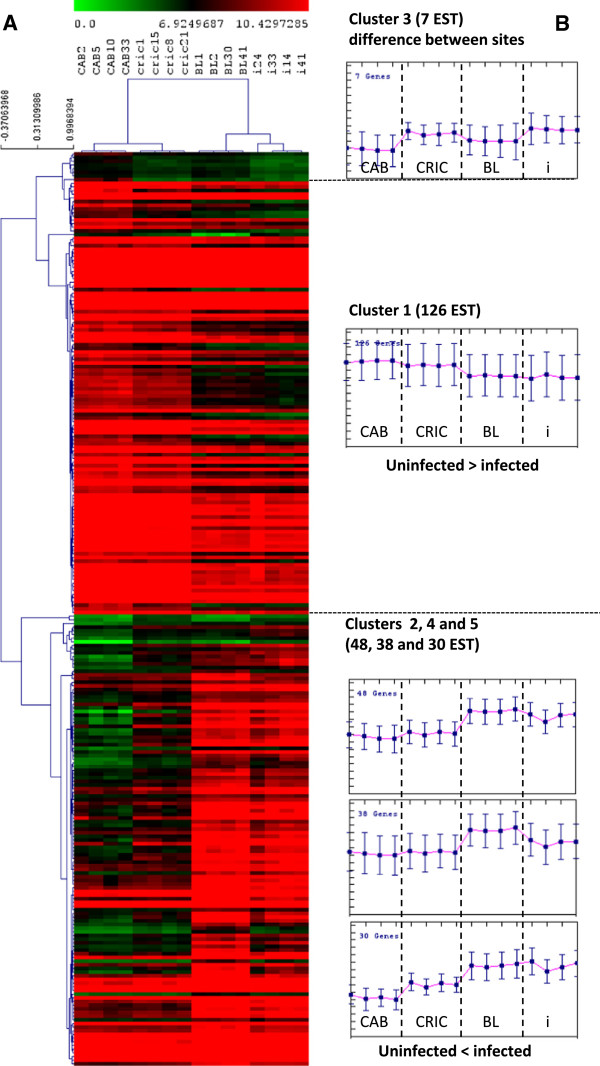
Figure 2.
Clustering of 249 ESTs obtained after ANOVA analysis with four groups (CAB, CRIC, BL and i – see legend to Figure1) with adjusted Bonferroni and p values< 0,01 made on TMeV 4.6.0 software (Saeed et al., 2003 and 2006). CRIC and i correspond, respectively, to uninfected spat from sanctuary area or from tank. A: Cluster 1 is a major cluster with 126 ESTs and cluster 3 is the smaller cluster with 7 ESTs. BL and CAB correspond to infected spat from oyster field (two levels 1 and 2 log class of viral GU ng-1 DNA). B: Graphs represent values transcriptional variation of genes in each category.

