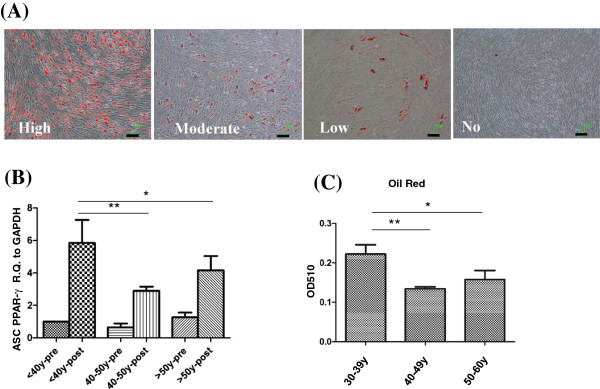
Figure 4.

Compromised of adipogenic differentiation capability in ASC derived from old donors. (A) Different levels of Oil Red O staining after induction of adipogenic differentionesis were demonstrated. Scale bar = 100 μm. (B) Mean mRNA levels of PPAR-γ are compared in different donor’s age groups (n = 3 in each group). Levels are expressed as mean ± SD. Pre: pre-induction. Post: post-induction. (C) Quantification of Oil Red O expression of ASC in the three groups (n = 3 in each group). *P < 0.05, ** P < 0.01.
