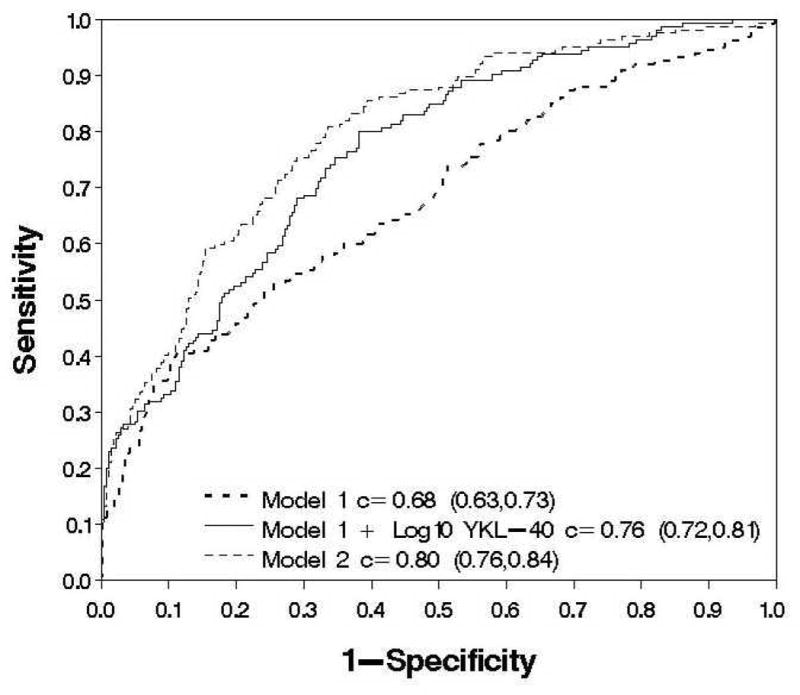
Figure 3.

Multivariate models of week 20 virological response in 456 HALT-C Trial patients. Model 1 which was derived from the overall HALT-C cohort consists of non-1 HCV genotype, HCV RNA level, non-black race, prior interferon monotherapy, and cirrhosis had a c-statistic of 0.68 (95% CI: 0.63, 0.73). The addition of baseline log10 YKL-40 levels to Model 1 had a c-statistic of 0.76 (95% CI: 0.72, 0.81) and was significantly better than model 1 alone in predicting week 20 virological response (p= 0.0004). In comparison, Model 2 which was derived from the current dataset and includes baseline log10 YKL-40, serum AST/ALT, non-black race, interferon monotherapy, and non-1 HCV genotype had a c-statistic of 0.80 (95% CI: 0.76, 0.84) and was significantly better at predicting week 20 virological response compared to Model 1 (p < 0.0001) and Model 1 with log10 YKL-40 (p=0.0080)
