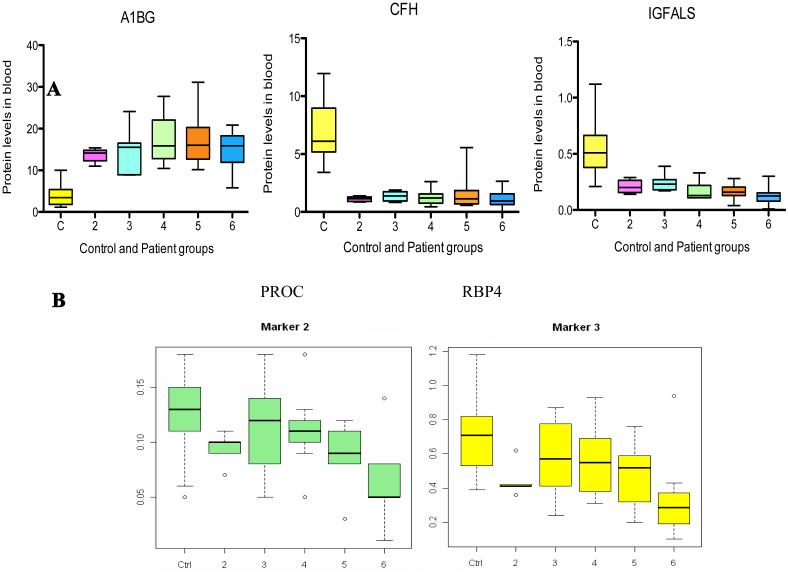
Figure 2.
Box plot analysis shows significant differences when comparing serum protein levels of A1BG, CFH and IGFALS in patients from Ishak fibrosis 2-6 against controls (C). The combined serum A1BG level of all patients is significantly elevated compared to the controls (P=7.4E-15), while the combined serum CFH and IGFALS levels are significantly decreased in patients versus controls (P=4.5E-08 and 5.7E-12, respectively) (2A). PROC and RBP4 levels in serum classify HCV patients in different stages of fibrosis. Box plot analysis shows strong evidence that the median serum levels of PROC and RBP4 in every Ishak fibrosis group decreased with the progression of the disease (2B). Each box represents the range between upper (75th) and lower (25th) quartiles with the median level shown as an intersect line. The minimum and maximum values (whiskers) within 1.5 IQR (the interquartile range).”

