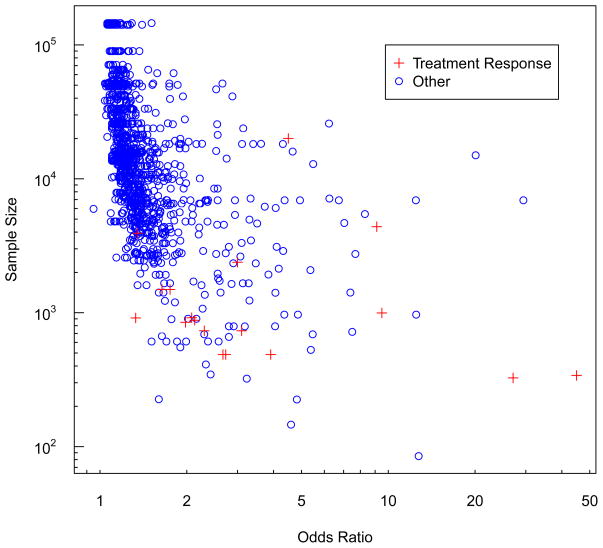
Figure 1.
Odds ratios and sample sizes for genetic variants association with binary traits from genome-wide association studies (P≤10−6). Red crosses are results from studies of treatment response (details given in Table 1). Blue circles are the 1,173 findings from all other binary traits reported in the NIH catalog of GWAS [14].

