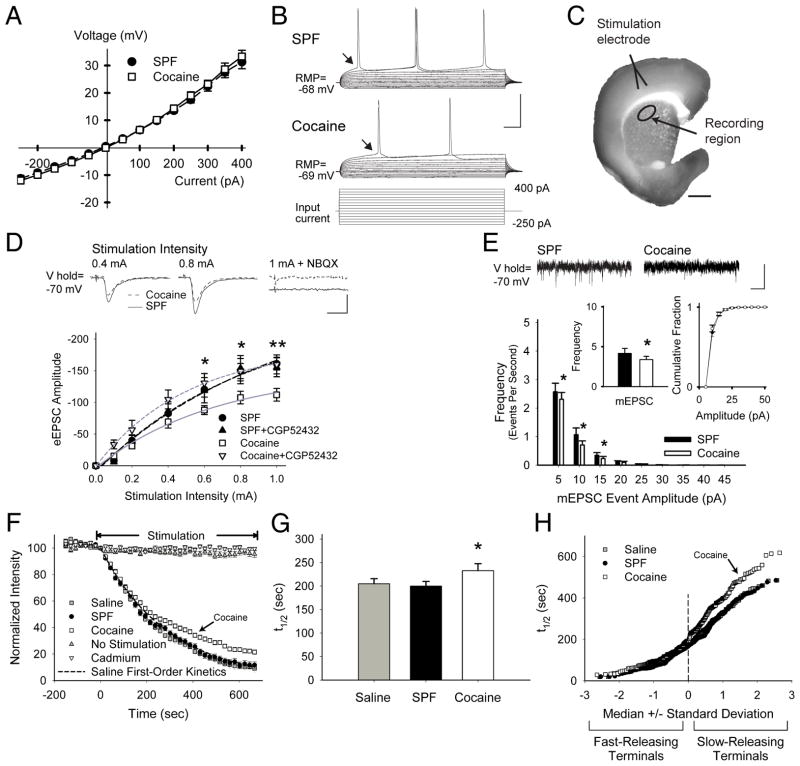
FIGURE 4.
PCE causes presynaptic depression through GABABRs. (A) Current clamp recordings in MSNs from SPF (n=15) and cocaine (n=11) mice displayed similar current-voltage curves with inward rectification, typical for MSNs (responses were measured at arrows in panel B). (B) Representative traces (above) demonstrate that fewer action potentials were generated in cells from cocaine mice in response to depolarizing current pulses (below). (C) The corticostriatal slice stained with FM1-43 and diaminobenzidine shows the areas of stimulation and recording. Corticostriatal activity was provoked using a bipolar stimulating electrode placed over cortical layers V–VI. Electrophysiological, optical, and biochemical recordings were obtained from the corresponding motor striatum (recording region), located 1.5–2.0 mm from the site of stimulation. (D) Representative traces (above) of voltage-clamp recordings show that similar cortical stimulation intensities evoked lower amplitude currents in MSNs from cocaine-exposed mice, compared to SPF. The AMPAR antagonist NBQX prevented evoked currents. Graph (below) shows the mean peak current evoked by the series of increasing cortical stimulation intensities in MSNs from SPF (n=10) and cocaine (n=12) mice. The GABABR antagonist CGP52432 had no effect on SPF cells, but blocked the reduction in eEPSC amplitudes in cocaine MSNs. *p<0.05, **p<0.01, t-test. Cells were voltage clamped at −70 mV to minimize post-synaptic GABAAR-mediated conductances (calculated ECl− = −74.2 mV).47 (E) Representative traces of mEPSCs (above; recorded in the presence of tetrodotoxin (1μM) show a reduction in low-release probability (5–20 pA) inward currents in cells from cocaine mice. The average frequency of mEPSCs (inset, left) was lower in cocaine MSNs (3.4±0.4 Hz), compared to SPF (4.2±0.6 Hz), while the cumulative mEPSC amplitude distributions (inset, right) were similar. *p<0.05, t-test. (F) Stimulation of axons or cell bodies of projection neurons in layers V–VI of the cortex overlying the motor striatum resulted in endocytosis of FM1-43 dye by recycling synaptic vesicles, characteristic of corticostriatal afferents.16 Following dye loading, cortical stimulation at 20 Hz (beginning at t=0) resulted in exocytosis of FM1-43 dye from the terminals, which decreased in a manner approximated by a single exponent, characteristic of synaptic vesicle fusion.22 Feedback from MSNs was prevented using glutamatergic receptor antagonists (see Supplemental Methods). FM1-43 destaining was activity and calcium-dependent since no stimulation (n=30) or bath-applied cadmium (200μM; n=25) prevented stimulated release of the dye from presynaptic terminals. As FM1-43 destaining generally followed first-order kinetics, corticostriatal release was characterized by the halftime (t1/2) of release, defined as the time required for terminal fluorescence to decay to half its initial value.22 (G) Mean ± SEM halftimes of FM1-43 release for destaining curves shown in panel F. FM1-43 destining was similar in slices from saline (t1/2=205 sec) and SPF (t1/2=200 sec) mice (p=0.6, Mann-Whitney), but was reduced in slices from cocaine mice (t1/2=233 sec; *p<0.05, Mann-Whitney). (H) An advantage of this optical technique is that we are able to examine vesicular release kinetics from individual cortical terminals. When the halftimes of individual terminals are presented relative to their standard deviation from the median value, a straight line indicates a normally-distributed (or single) population.15 Normal probability plots of individual terminal halftimes of release for experiments in panel F show that PCE decreased exocytosis from the slowest-releasing terminals (those with the highest t1/2). This depression in corticostriatal release following PCE was not due to an inadequate innervation since the number of active corticostriatal terminals was higher in cocaine mice (61.4±10 puncta vs. 41.9±5 for saline; p=0.02, ANOVA). Bars: B, 40 mV, 25 ms; C, 1 mm; D, 50 pA, 5 ms; E, 10 pA, 250 ms. Curves were fit with a Hill equation.

