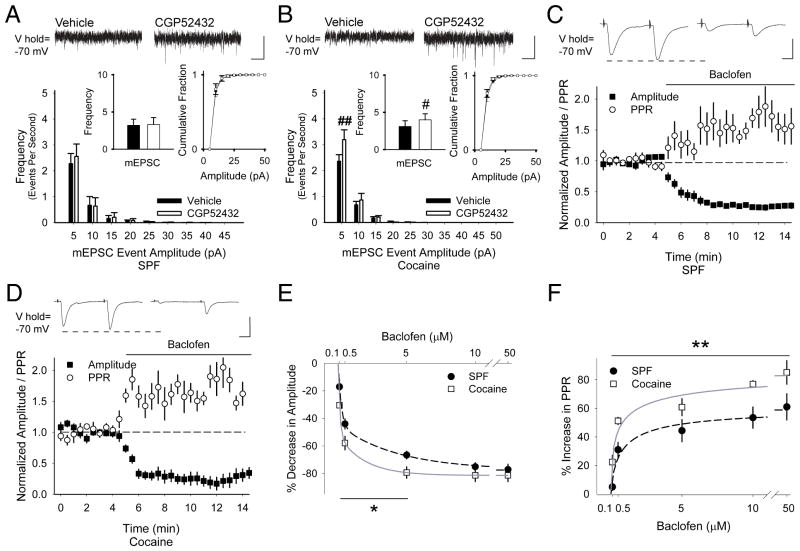
FIGURE 5.
(A) Representative traces show that CGP52432 had no effect on the frequency of mEPSC in cells from SPF mice (3.2±0.8 Hz in vehicle vs. 3.3±0.9 Hz following CGP52432; p=0.1, paired t-test) and the cumulative distribution of mEPSC amplitudes was unchanged. (B) CGP52432 increased the frequency of mEPSCs in cells from cocaine mice (3.1±0.8 Hz in vehicle vs. 3.9±0.8 Hz following CGP52432) and the cumulative mEPSC amplitude distribution was unchanged. #p<0.05, ##p<0.01, paired t-test. (C) Representative traces show the average responses to paired-pulses delivered at 50 ms every 30 sec before (above, left) and 5 to 7.5 min following bath application of baclofen (above, right). Graph shows the normalized amplitude of the first eEPSC (of the pair) and the normalized PPR. Baclofen reduced the amplitude of the first eEPSC (−92±23 pA for vehicle vs. −21±5 pA following baclofen) and increased the PPR (1.1±0.1 in vehicle to 1.6±0.2 following baclofen) in MSNs from SPF mice. (D) In cells from cocaine-exposed mice, baclofen reduced the amplitude of the first eEPSC (−59±6 pA for vehicle vs. −13±4 pA in baclofen) and increased the PPR (1.2±0.1 in vehicle vs. 1.8±0.4 in baclofen). (E) Concentration-curves demonstrate that baclofen (100 nM – 50 μM) reduced the amplitude of the first eEPSC and (F) increased the PPR to a greater degree in MSNs from cocaine-exposed mice than in SPF controls (IC50= 4.2 μM;48 n=6, 5, 12, 5, 6 cells for SPF and n=4, 5, 5, 4 for cocaine. *p<0.05, **p<0.01, ANOVA). Bars: A and B, 10 pA, 250 ms; C and D, 100 pA, 12.5 ms.

