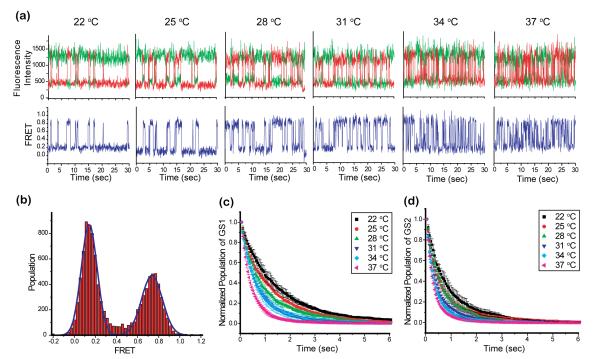
Figure 7.
Temperature-dependent investigation of the GS1 ⇄ GS2 equilibrium obtained using our microfluidic platform in combination with TIRF microscope-based smFRET measurements at controlled temperatures of 22, 25, 28, 31, 34, and 37 °C. (a) Representative Cy3 and Cy5 emission intensities and FRET versus time trajectories. Cy3 and Cy5 emission intensities versus time trajectories are shown in green and red, respectively (top row). The corresponding smFRET versus time trajectories are shown in blue (bottom row) (Supporting Methods). (b) Histogram of idealized FRET values (Supporting Methods) built using the data collected at the 22°C temperature point as an example. Dwell time histograms of (c) GS1 prior to undergoing a GS1→GS2 transition and (d) GS2 prior to undergoing a GS2→GS1 transition at the various temperature points that were investigated (see Supporting Methods).

