
Figure 2.
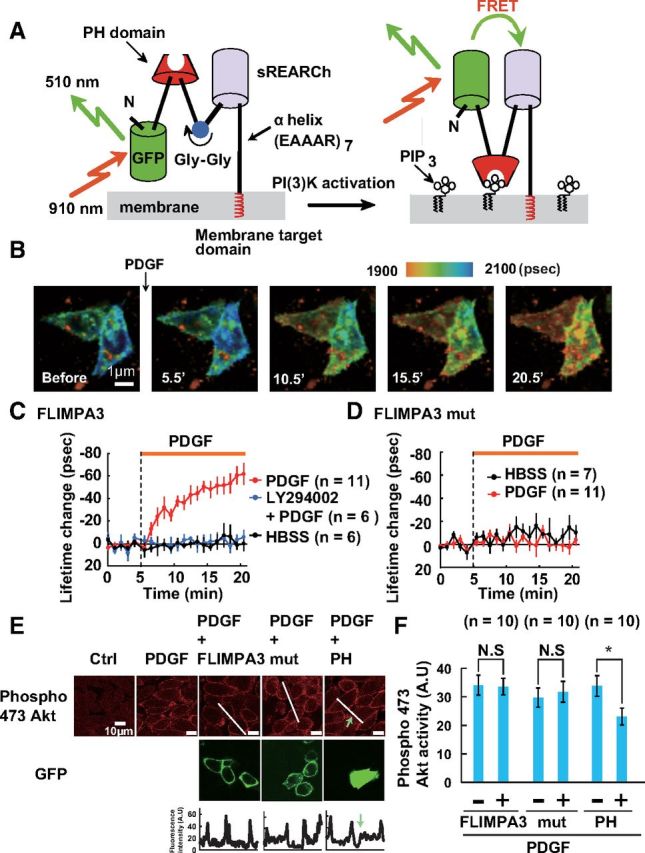
Characterization of FLIMPA3 in living cells. A, Principle of FLIMPA3 for visualizing PIP3. PIP3 production induces a conformational change in FLIMPA3 through the binding of the PH domain to PIP3, leading to an increase in FRET and a decrease in fluorescence lifetime. B, Fluorescence lifetime image of FLIMPA3 in PDGFR-expressed CHO cells. A color gradient was used to represent PIP3 levels, with a warmer color indicating a shorter fluorescence lifetime and higher PIP3 levels. The images before (0 min), and 5.5, 10.5, 15.5, and 20. 5 min after addition of 50 ng/ml PDGF were shown. Scale bar, 1 μm. C, Time course of the fluorescence lifetime change of FLIMPA3 in CHO cells after the addition of HBSS, or 50 ng/ml PDGF with or without pre-incubation with 100 μm LY294002. D, Time course analysis of the fluorescence lifetime change of FLIMPA3 mutant in CHO cells after administration of HBSS or 50 ng/ml PDGF. E, F, Effect of FLIMPA3 on PIP3 signaling assessed by PDGF-induced Akt phosphorylation. Akt phosphorylation at serine residue 473 was detected with Alexa 555-conjugated anti-phospho 473 antibody. Bottom, Indicates immunostaining signal taken from white lines in top.