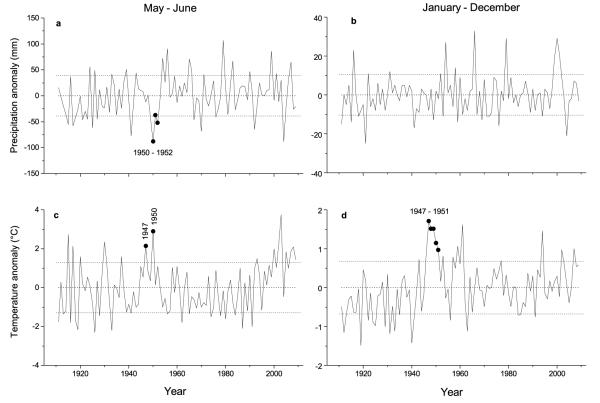
Fig. 6.
Time series plots of May – June and January – December precipitation (a, b) and temperature anomalies (c, d) relative to 1911-2009 average. Long-term means for precipitation and temperature are 158 ± 39 mm (May – June) and 716 ± 104 mm (year) and 13.6 ± 1.3 °C (May – June) and 7.3 ± 0.7 °C (year), respectively. Closed symbols indicate anomalies in climate variables during 1947-1952. Horizontal dashed lines indicate standard deviation.

