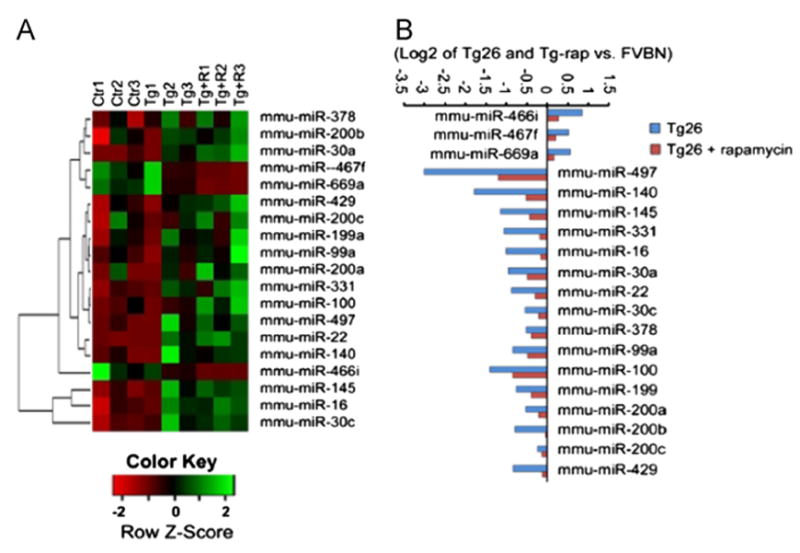
Fig. 2.

Differential expression of miRNAs in kidneys of Tg26 and rapamycin-treated Tg26 mice. (A) Heatmap depicts triplicate microarray hybridizations, revealing a subset of miRNAs that are differentially expressed in rapamycin-treated Tg26 mice compared with Tg26 and control FVB/N mice. The color scale shown at the bottom: green denotes expression >40 and red denotes an expression <0. (B) The relative expression of miRNAs level is present in log2 transformation. Total 3 miRNAs were upregulated (right) and 16 miRNAs were downregulated (left) in rapamycin-treated Tg26 mice (P<0.05).
