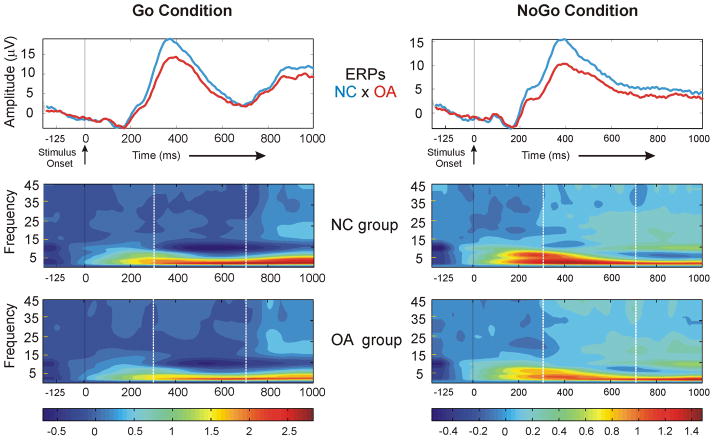
Figure 1.
The ERPs and time-frequency representation of Go and NoGo condition for the NC and OA groups at CZ electrode. Note the lower P3 amplitude and decreased energy in low frequency activity in both Go and NoGo conditions in the OA compared to the NC group. The time window of 300–700 ms is marked with dotted white line in the time-frequency plots. The color scale represents the decomposed energy for both groups.

