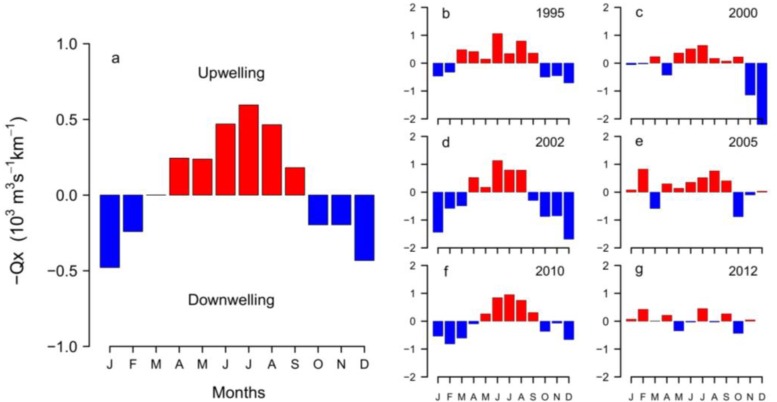
Figure 3.
(a) Monthly average (1967–2011) Ekman transport (m3 s−1 km−1) estimated from the FNMOC-model; (b–g) Monthly Ekman transport of selected years with normal (1995, 2002 and 2010) and anomalous (2000, 2005 and 2012) upwelling patterns in relation to the historical monthly average in the Galician Rías Baixas.

