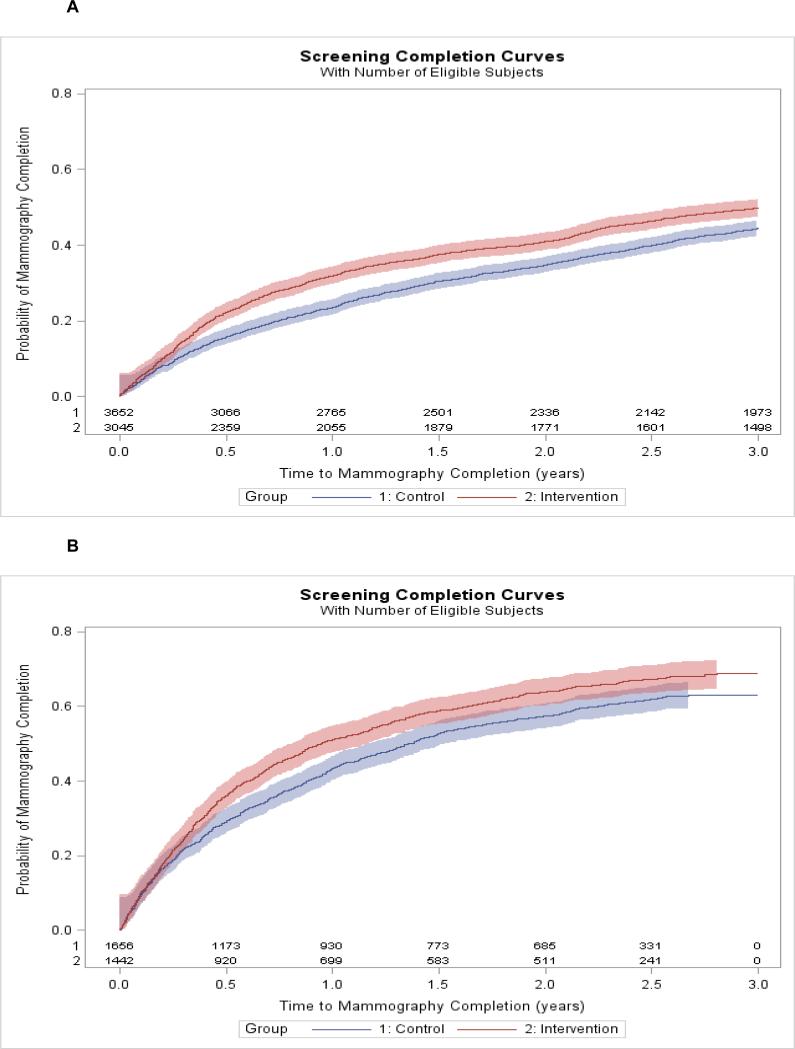
Figure 3.
Kaplan-Meier curves of time to mammography completion during 3 years of follow-up among, A. women overdue at the start of follow-up (prevalent overdue) and B. women becoming overdue during the first year of follow-up (incident overdue) in intervention and control practices. Shaded area around each line represents the 95% confidence interval for that Kaplan-Meier curve.

